Visual Resolution (Blur vs. Clarity) and Attention
Visual Resolution and Eye Movements
We constantly move our eyes while looking at scenes, making saccades (eye movements) about 3 times per second. Most vision researchers assume that we move our eyes in order to make up for our poor visual resolution in the visual periphery. But what level of resolution does the brain use to guide our eyes to new locations? An initial study (Loschky & McConkie, 2002) used a gaze-contingent multi-resolutional display, which used eye tracking together with a computer to show high resolution (clear) imagery in a circular region (the "window") that was centered on wherever the person was looking, and lower resolution (blurry imagery) outside the window. The figure below shows some examples of images with smaller and larger windows, with lower resolution (blur) and increasingly higher resolution (clarity):
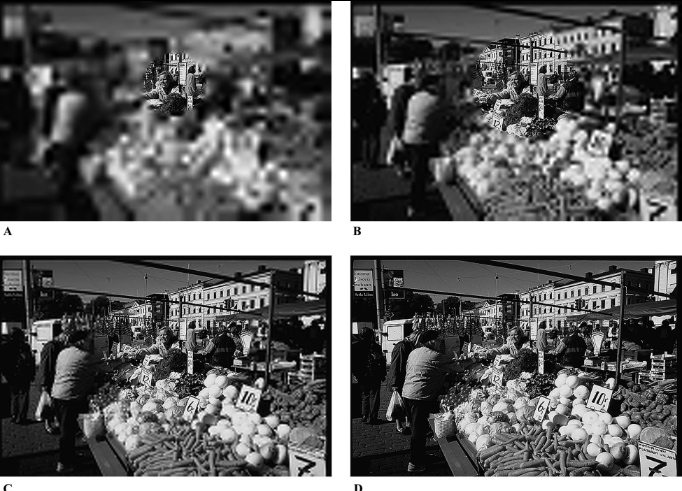
Example images used in the study with varying window radii and peripheral resolution levels. Panel A: smallest window (radius: 1.6°) with lowest resolution; Panel B: medium window (radius: 2.9°) with medium resolution; Panel C: largest window (radius: 4.1°) with higher resolution (Level 7); Panel D: control condition (constant highest level resolution).
That study (Loschky & McConkie, 2002) found that there is a threshold level of image resolution below which the eyes are less likely to go to a certain image region. This saccade-targeting threshold varies as a function of both image resolution and distance from the center of vision; with increasing eccentricity (distance from the center of vision), image resolution decrements must be greater to affect saccade targeting, as shown in the Figure below:
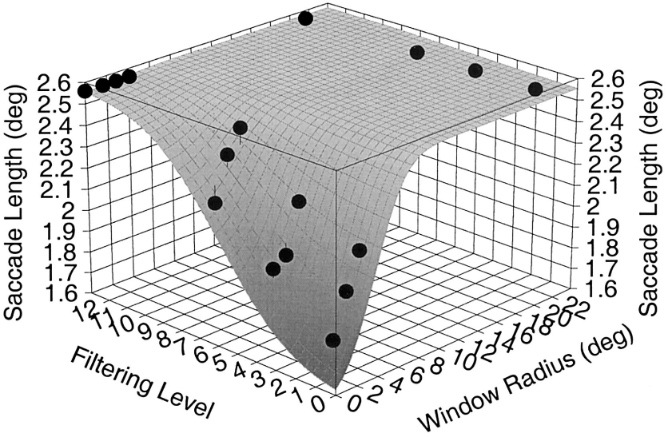
A follow-up study (Loschky, in preparation) found that the saccade-targeting threshold is lower than the image blur detection threshold. Thus, relatively low resolution information is useful for guiding the eyes in natural scenes, but there are limits beyond which low-resolution information loses its utility. We have argued that the brain uses a neural competition among potential saccade targets in which removing useful spatial frequencies reduces the saliency, or allure, of potential saccade targets, thus increasing the attractiveness of closer, less filtered objects with useful information.
Blur Detection is Unaffected by Cognitive Load
When you are looking around in the visual world, if you are dual-tasking, or under some sort of cognitive load, your visual performance is often worse. In those cases, attention is required for the visual task. However, in a series of studies, we found that viewers can detect blur in an image regardless of how much or little cognitive load they are under. This is surprising, and suggests that blur detection does not require attention to be perceived.
In those studies, gave viewers a task of memorizing scene images and a secondary task, to detect image blur whenever they saw it. We again presented the blur gaze-contingently, so that where it was presented was based on where they were looking at that moment, using eye tracking. Blur would appear at one of four different retinal eccentricities (0°, 3°, 6°, and 9°), starting at the center of vision and moving farther into the visual periphery, as shown in the figure below:
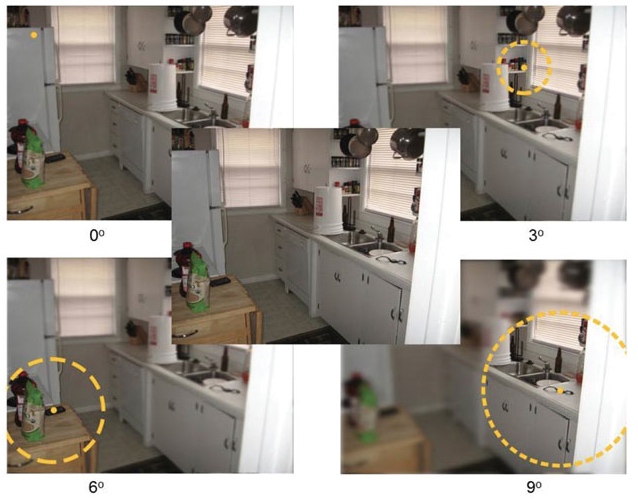
Sample images that were blurred at 0°, 3°, 6°, and 9° retinal eccentricity from an unblurred base image (center). The yellow dotted ring represents the edge of the window (absent in the 0° retinal eccentricity where the entire image is blurred), but was not seen by the participants. Note that the strength of the blur increases with increasing window edge retinal eccentricity (as represented by distance from the yellow dot to the dotted ring, neither seen by participants). This was done to equate blur detectability at each retinal eccentricity
We manipulated cognitive load using a third task, the N-back working memory task (illustrated in the figure shown below). The N-back allowed us to vary the level of difficulty. The N-back task was tested in both an audio and visual format, as illustrated in the two video clips shown below:
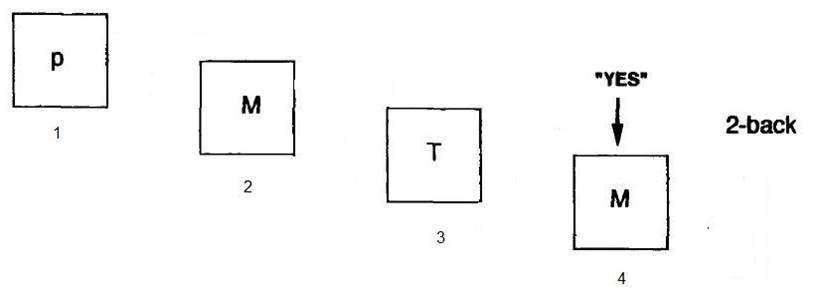
This video illustrates our gaze-contingent blur detection experiment with an auditory N-back task. An N-back letter was presented every 2 seconds. Please make sure that the volume on your computer is turned up in order to hear the N-back letters. The green dot moving around the image represents the subject's eye movements and was not present during the actual experiment. Gaze-contingent blur appeared every seventh fixation, with the exception of catch-trials.
This video illustrates our gaze-contingent blur detection experiment with a visual N-back task. An N-back letter appeared at the point of fixation every 3 seconds and remained in place if a subject moved their eyes.
We hypothesized that paying less attention to the blur would make it harder to detect, so blur detection sensitivity would decrease as the N-back task became more difficult. The results from the auditory N-back task are shown below (the visual N-back results were essentially identical):
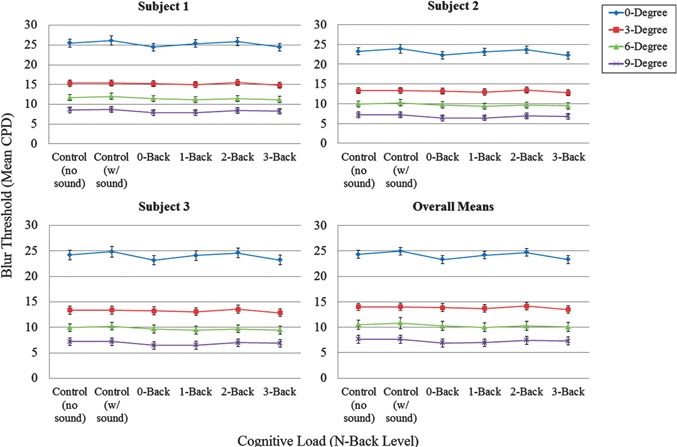
Experiment 1 (Loschky et al., 2014), blur detection low-pass filtering cut-off thresholds (in cpd) as a function of cognitive load (in terms of N-back level, or control condition) and retinal eccentricity (in degrees visual angle). Results shown for individual participants (1–3) and their overall mean. Error bars = 95% CI of the mean.
The results of these studies showed a significant main effect of eccentricity on blur detection - that is, at the center of vision, image blur that was very subtle could be detected, but in order to detect blur in the visual periphery, it needed to be stronger. However, adding the N-back task had no effect on blur detection sensitivity, indicating that blur detection is unaffected by cognitive load. This was a surprising result, and suggests that blur detection does not require attention, in other words, it is perceived pre-attentively (Loschky, Ringer, Johnson, Larson, Neider & Kramer, 2014).
The Effects of Blur on Visual Selective Attention
In this study, the effect of blur/clarity contrast on selective attention was investigated in terms of the role of unique blur/clarity contrast in guiding selective attention. In film, one technique that directors use to guide their audience's attention is to use depth of field to focus in on objects or people of interest thus making them appear clearly and thereby blurring other areas of less relevance in the scene at other distances. In Video 1 below there is a simplified version of this technique to provide an example of how blur/clarity contrast guides attention. When viewing the short clip (2 seconds), answer these two questions: 1) At the beginning of the clip do you first look at the L or the T? 2) At the end of the clip, which are you looking at?
Note. Peterson (2016). The following clip should allow for the viewer to be guided from the clear T at the beginning of the clip to the clear L at the end of the clip.
Dual-task evidence from Loschky et al. (2014)(described above) found that blur may be preattentively processed. The current research (Peterson et al., 2015; Peterson et al., 2016) investigated how blur guides selective attention. Typical visual search results indicate that when a target is a unique item, thereby differing from all distractors by at least one feature, the target will often be highly salient leading to pop out (Treisman & Gelade, 1980). For example, a red square amongst green squares will pop out in a similar manner to a green square amongst red squares. However, blur may not capture selective attention in the same way as other preattentive features, such as orientation, size, color, etc. Blur has previously been suggested to be avoided by viewer's gaze with eye tracking evidence when unique regions of clarity are also present in a scene (Loschky & McConkie, 2002)(described above). Yet another possibility is that blur is ignored by selective attention, as found by Enns and MacDonald's (2012, Exp. 3). Therefore, there are three alternative competing hypotheses of how blur may guide selective attention: blur may capture attention, repel attention, or be ignored. Each of the three hypotheses were quantitatively modeled to see which explained the observed data best. Figure 1 below displays the hypotheses based on how unique blur and clarity may be observed through reaction times (RT) influencing selective attention by predicting the average number of items searched.
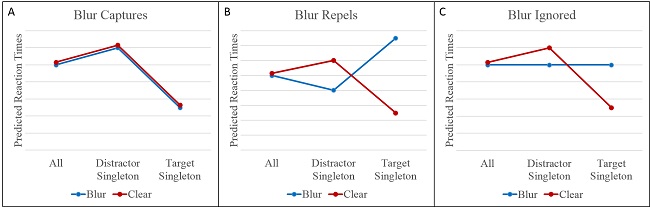
Figure 1. Generalized hypothesized reaction times based on predicted average number of items searched, A). Blur Captures, B). Blur Repels, and C). Blur Ignored.
Method
A rotated L versus T search task was used, which is well-known for requiring serial processing (Wolfe et al., 1989; Egeth & Dagenbach, 1991; Jiang & Chun, 2001) while manipulating blur/clarity contrast to be non-predictive of target location. A control study preceded the experiment and found that when the letters were perceptually blurred they did not significantly differ in accuracy or RTs to identify the letters, thereby allowing conclusions to be made about the influence unique blur and clarity have on selective attention without legibility concerns. Figure 2 below displays search arrays of the conditions in the experiment (Peterson et al., 2016).
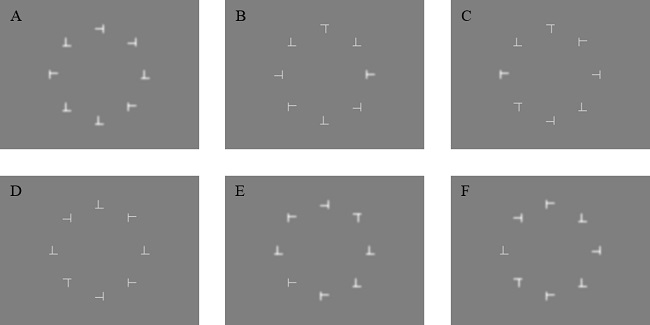
Figure 2. Examples of blur/clarity manipulations: A). All-Blurred, B). Blurred Target Singleton, C). Far Blurred Distractor Singleton, D). All-Clear, E). Clear Target Singleton, F). Near Clear Distractor Singleton. The search arrays were either uniformly blurred or clear, or they had one unique letter either clear or blurred that was counterbalanced for each location relative to the target position. Although not shown here, there are also Mid and Mid-Far Distractor conditions as well.
Results
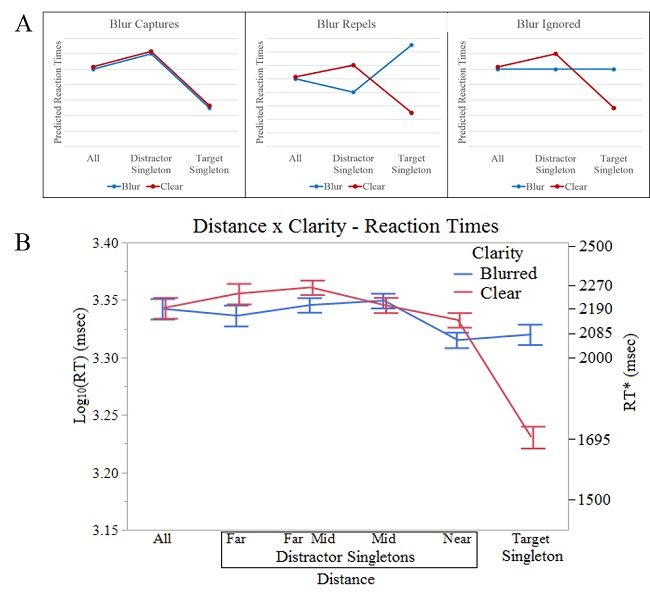
Figure 3. A). Predicted alternative competing hypotheses, B). Log10(RT) marginal means for Clarity x Distance with +/- 1 SEM bars. Secondary y-axis presents untransformed reaction times (RT*) values distributed on a logarithmic scale.
As shown in Figure 3, a visual comparison of the data from the experiment (3B) with the three alternative competing hypotheses (3A) suggests that the Blur Ignored hypothesis is most supported. As predicted by all three hypotheses, the all-blurred and all-clear conditions did not significantly differ, indicating that legibility was controlled for, and the clear target singleton's RTs were shorter than any other clear condition, showing that unique clarity captured attention. The key results supporting the Blur Ignored hypothesis were that the blur target singleton did not significantly differ from the all-blurred condition (Rejecting Blur Repels Hypothesis), but did have a significantly longer reaction time than the clear target singleton (Rejecting Blur Captures Hypothesis). In all, the results strongly supported the hypotheses that unique clarity captures attention, while unique blur is ignored by selective attention (Peterson et al., 2016).