How Lipid Profiling Works
 We use a tandem mass spectrometer with a collision cell (chamber where fragmentation occurs) between the two mass specs ("triple quad"; we have an Applied Biosystems API 4000 and an Applied Biosystems Q-TRAP, which is also a "triple quad"). Our sample introduction is electrospray ionization. No pre-separation is used. Two types of scans are used to obtain polar lipid profiles: precursor (Prec) and neutral loss (NL) scans. Scans are specific to particular lipid classes; some classes are analyzed with precursor scans, and others are analyzed with neutral loss scans. The sample is introduced by continuous infusion in solvent into the electrospray ionization source, where lipid molecular ions are produced from the lipid molecules. In our current method, PC, lysoPC, SM, PS, PE and lysoPE are analyzed as singly-charged positive [M+H]+ ions, MGDG, DGDG, PG, PI, PA, and PS are analyzed as singly-charged [M + NH4]+ ions, and lysoPG as negative [M-H] - ions. The ions that are available for analysis depend on the solution in which the lipids are dissolved and on the source voltage. The ions enter the mass spectrometer in the gas phase.
Inside a quadrupole mass spectrometer, the ions are in an electrical field. At a certain electrical field strength, ions of a particular mass/charge ratio will move straight toward the detector at the end of the tandem mass spectrometer ion path. Scanning, or systematically varying the electrical field strength produces a plot (spectrum) of signal (ion hits at the detector) vs. mass/charge (correlated with electrical field strength). In the case of lipids, the charge is almost always 1, so mass/charge = mass. Scanning of the ions in a tissue or cell extract with one quadrupole mass spectrometer produces many peaks, with some peaks representing several molecular species of lipids (i.e., different lipid molecular species with the same mass). Precursor or neutral loss scans allow specific detection of species within particular head group classes and allow identification and quantification of individual lipid molecular species.
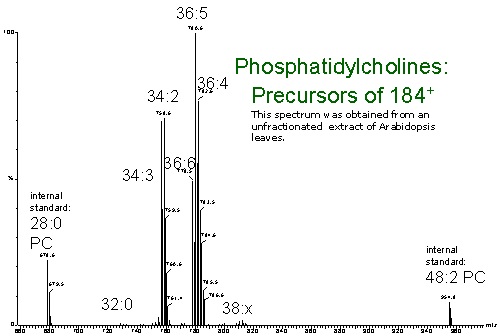
For precursor spectra (scans), we set the second mass spec at a constant electrical field that allows only ions with a mass that corresponds to a characteristic charged fragment generated from the polar lipid head group to move to the detector. Then we scan with the first mass spec. The second mass spec effectively acts as a "filter" so that we only see a "hit" at the detector when a molecular ion from the first mass spec produces the characteristic head group fragment. Thus, the spectra show only the lipids that have that head group fragment. Usually this corresponds to the lipids in one head group class.
A neutral loss spectrum also shows the lipids in a single class, but we obtain this type of spectrum when the charge does not localize to the lipid head group after fragmentation. In these lipids, the diacylglycerol ions produced vary in mass as a function of the molecular ion acyl composition, but the DIFFERENCE in mass between the molecular ion and the charged DAG fragments is constant (corresponding to the head group). So, we scan with the second mass spec in sync with the first mass spec with an electrical field offset that corresponds to the mass of the neutral head group fragment. Similar to precursor scanning, we only see a hit at the detector when the first mass spec is at a field strength that corresponds to a mass generating the characteristic neutral loss of the head group.
All the spectra are plots of signal at the detector located after the second mass spec vs. the molecular ion mass scanned by the first mass spec.
A series of precursor and neutral loss scans are performed sequentially (see table below).
Sequentially Performed Scan Functions
| Scan Mode | Precursor or Neutral Loss Fragment | Lipid Class Detected |
| + | Prec 184 | PC/LysoPC/SM |
| + | NL 141 | PE/LysoPE |
| + | NL 185 | PS |
| + | NL 277 | PI |
| + | NL 189 | PG |
| + | NL 115 | PA |
| + | NL 179 | MGDG |
| + | NL 341 | DGDG |
| - | Prec 153 | LysoPG |
The molecular species are identified by (1) the presence of a specific head group fragment and (2) the mass. The mass generally allows us to assign a specific number of acyl carbons and number of double bonds.
Corrections are applied to the data for "isotopic overlap". This phenomenon is due to the approximately 1% natural abundance of 13C. This means that a molecular ion with 50 carbons, for example, will produce not one, but a series of peaks: (1) a peak at the "nominal" mass, A; (2) a peak at A+1, from the species containing one 13C atom, with 56% of the signal of the A peak; (3) a peak at A+2, from the species containing two 13C atoms, with 15% of the signal of the A peak; (4) a peak at A+3, from the species containing three 13C atoms, with 3% of the signal of the A peak. Since the presence/absence of a double bond in a lipid species causes a difference of just two mass units, the A+2 peak of one species will produce a signal at the same mass as the A peak of another (more saturated) species. The contribution of A+2 species to the signal of the second peak must be subtracted. This is what is meant by correcting for the isotopic overlap.
After these corrections, the peaks on the spectra are quantified in comparison to a group of internal standards. Generally, two internal standards of each head group class are used. We also do our best to subtract any signal that may be due to low levels of contaminants in our internal standard mixture.
Users of the Kansas Lipidomics Research Center Analytical Laboratory may provide us with weights or other values for normalization of the data. The data for each lipid molecular species will be presented as nmol (per weight) and/or as mol% of the total lipids analyzed.
The precursor and neutral loss methodologies that we routinely utilize contrast with the more typically used "product" ion scans in which the first mass spec is held at a constant electrical field, corresponding to a particular molecular ion mass, while scanning is performed with the second mass spec to detect the fragments made in the collision cell. Product ion scans can be used to determine the head group or other fragments that are produced, as well as to identify the fatty acyl groups in particular polar lipid molecular species, when this additional analysis is required.
References:
Brügger, B., G. Erben, R. Sandhoff, F. T. Wieland, and W. D. Lehmann. 1997. Quantitative analysis of biological membrane lipids at the low picomole level by nano-electrospray ionization tandem mass spectrometry. Proc. Natl. Acad. Sci. USA. 94, 2339-2344.
Welti, R., W. Li, M. Li, Y. Sang, H. Biesiada, H. Zhou, C.B. Rajashekar, T.D. Williams, and X. Wang. 2002. Profiling membrane lipids in plant stress responses: Role of phospholipase D{alpha} in freezing-induced lipid changes in Arabidopsis. J. Biol. Chem. 277, 31994-32002.
Xiao, S., Gao, W., Chen, Q.-F., Chan, S-W., Zheng, S. -X., Ma, J., Wang, M., Welti, R., and Chen, M.-L. (2010). Overexpression of Arabidopsis acyl CoA binding protein ACBP3 promotes starvation-induced and age-dependent leaf senescence. Plant Cell 22, 1463-1482. Note: Our current method is described in the supplemental data.