Lipids Analyzed
The lists below represent molecular species that we routinely detect and quantify. Nomenclature is total acyl carbons: total double bonds. We can identify individual acyl species as needed, but it is not a routine part of our analyses.
If you are interested in analysis of other types of lipids, please contact us. Other lipids that we can analyze include hexosylceramides, Arabidopsis glycosylinositol phosphoceramides, mono- and di-methylphosphatidylethanolamines, sulfoquinovosyldiacylglycerols, triacylglycerols, diacylglycerols, many oxidized glycerolipids, many head-group acylated membrane lipids, and others.
Regarding amount determination: We report the amounts as normalized signal/(tissue metric that you provide). This means that we will compare the signals for the peaks in your sample to the signals for peaks of internal standards that we are adding in known amounts (listed at right), and we report the data so that the signal that is represented as 1 = the same signal as 1 nmol of internal standard (usually with an adjustment for variation in response with m/z). If your compounds are diacyl or monoacyl phospholipids, the response of each compound is very close (within 5 or 10%) of the response of an internal standard of the same class. Thus, the numbers that we report as normalized signal/(tissue metric) for diacyl or monoacyl phospholipids can be considered to be equal to nmol/(tissue metric). However, with other compounds, including ether-linked lipids, glycolipids, and neutral lipids, there is some variation in molar response among compounds within a class and/or in comparison to the internal standard. Additionally, we may not have access to an internal standard that closely matches the structure of the lipids in sample, and thus we may use a poorly matched standard. All this means that the normalized signal/(tissue metric) will allow for reasonably good comparison of the same lipid among samples, but may not provide an accurate indicator of the relative amount of that lipid compared to other compounds in the sample. Thus, we suggest that you present your data on compound as normalized signal/(tissue metric).
Notice regarding amount determination and galactolipid response (4-29-16): Starting on 4-29-16, KLRC is correcting our MGDG and DGDG values by dividing the the observed “signals”, which are based on comparison with the fully saturated MGDG and DGDG internal standards, by 2.8. In other words, we have determined that the average unsaturated MGDG or DGDG gives an [M + NH4]+ peak intensity that is 2.8 times the intensity of a peak from an equimolar amount of a fully saturated MGDG or DGDG peak, and we are correcting for this, so that the results can be presented in molar amounts. (Please note that we were not able to accurately determine individual response factors for various unsaturated galactolipid molecular species.) Thus, we now are including additional calculations (compared to the previous data) and the data are now presented both as signal per mg and % total signal, which represent uncorrected values for polar plant lipids (as previously presented), AND also as nmol per mg and mol%, which take into account the response factor. If you would like to correct MGDG and DGDG data acquired at KLRC as [M + NH4]+ (between ~2009 and 2016), you can divide the MGDG and DGDG values by 2.8. Generally data in signal per mg can be converted to nmol per mg this way. Phospholipid "signal per mg" data is already equivalent to "nmol per mg" (see previous paragraph).
Plant polar lipids
The list below represents the 144 lipid molecular species that we can detect
and quantify, based on data from Arabidopsis leaves and cotton fibers.
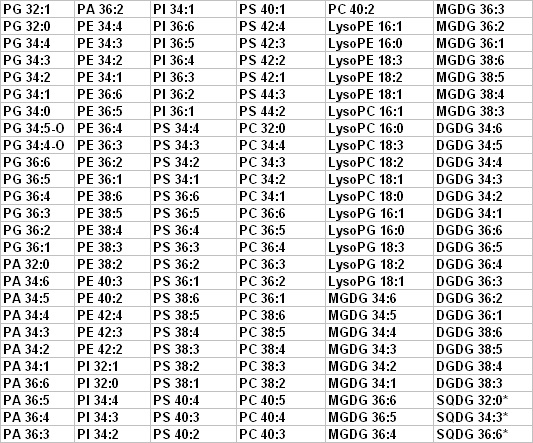
*not part of routine analysis
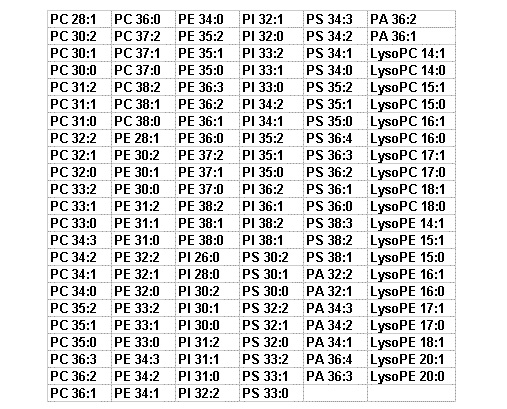
Yeast polar lipids
Below are the yeast lipid species that we are prepared to quantify if/when they occur in yeast samples. Of these 136 species, 42 overlap with the list for plants, and 94 are unique.
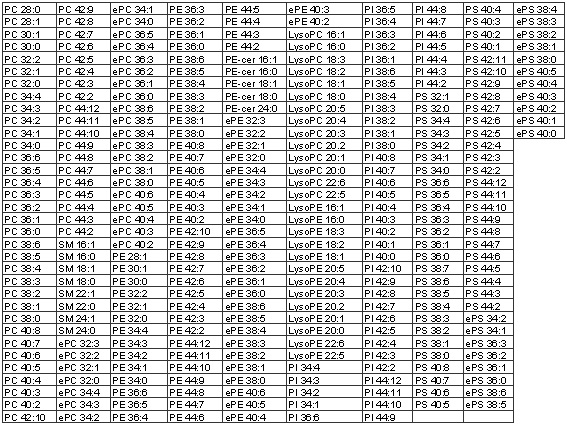
Animal Polar Lipid Species
Below are the animal lipid species that we are prepared to quantify if/when they occur in animal samples. It should be noted that the identifications are by (1) the ability to produce a fragment characteristic of the phospholipid head group and (2) the mass. While these criteria provide clear identification of most species, there is some potential ambiguity with some of the highly unsaturated compounds; a highly unsaturated diacyl compound may share a mass with an ether lipid, for example. In the data that we assemble, we try to indicate where these ambiguities are. While we are currently able to offer these analyses, we are also working to improve them.