Kansas Climate Report: Week Ending August 11
Original report by Matthew Sittel, Assistant State Climatologist
Temperature:
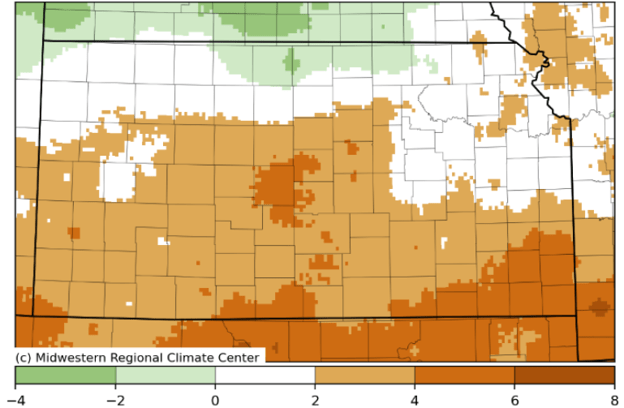
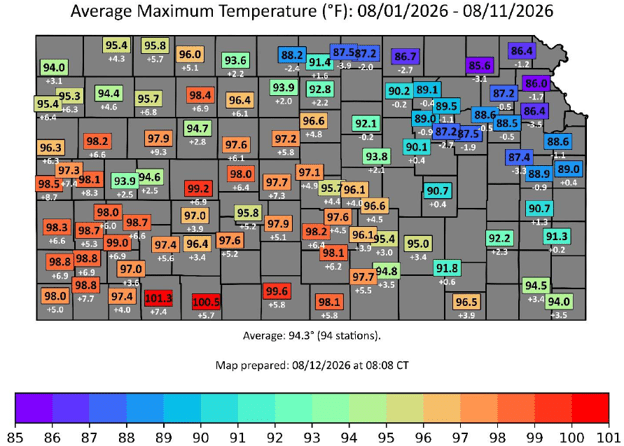
A warming trend during the period brought above normal readings back to the state after a brief respite from intense heat. Temperatures were below normal to begin the period on the 5th, warmed to near normal on the 6th, and from then on, temperatures averaged above normal. There was a noticeable gradient across the state, as northeast Kansas was quite a bit cooler than the west, thanks to persistent cloud cover, precipitation, and higher dew points. Highs soared past the century mark on multiple days across western as well as parts of central Kansas. A few locations surpassed 110 degrees on August 9, including at the Denmark Mesonet site in Lincoln County, where the high was 113°, the warmest reading recorded by the Kansas Mesonet this year. The co-operative observer at Webster Dam in Rooks County eclipsed the Denmark site by a degree, reaching 114° for the second time this summer and tying itself for the highest reading in the state this year.
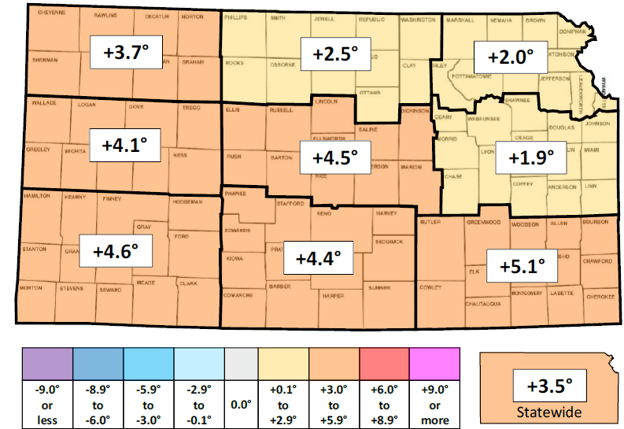
The statewide 7-day average temperature was 82.0°, or 3.5° above normal. All divisions were above normal; departures ranged from +1.9° in east central to +5.1° in southeast Kansas. For the first 11 days of August, the statewide average temperature is 80.5°, or 1.8° above normal. Above normal days slightly lead the below by a count of 6 to 5. In the 131-year climate record of the National Centers for Environmental Information, the average August temperature in Kansas was at least 80° a total of 18 times. The record for warmest August is 84.3° set during the Dust Bowl era in 1936.
Precipitation:
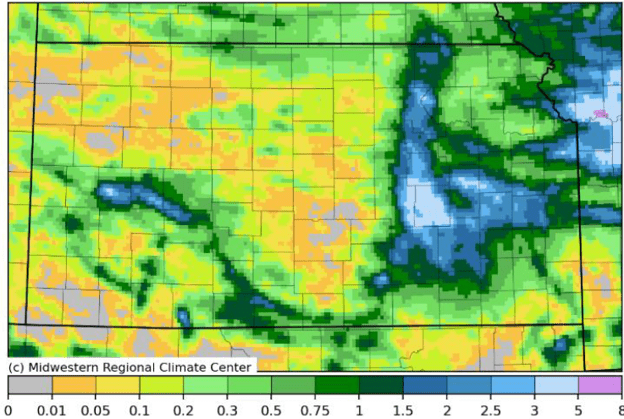
The heaviest rainfall amounts for the period were across the eastern third of the state, while significant precipitation was more isolated across the remainder of Kansas. The week’s highest totals were the result of thunderstorms that formed late on the 6th and lasted through the morning of the 7th. Storm motion was generally north to south, allowing cells to repeatedly train over the same areas. Totals over 2 inches were observed along a line from west of Manhattan to the Wichita metropolitan area. The co-operative observer at Elmdale measured 4.24” for the 24-hour period ending at 7 AM on the 7th. Additional heavy rainfall amounts from this event include 3.42” in Morris County (Herington 6.6 SSE), 2.70” in Sedgwick County (Derby 0.9 SSE), 2.63” in Pottawatomie County (Olsburg 4.0 SW), and 2.28” in Riley County (Riley 0.0 WNW). The driest parts of the state were northwest, north central, and central Kansas, where many totals were less than one-quarter of an inch. Some of the lower totals for the week include: 0.01” at Garden City Regional Airport, 0.02” at Concordia, 0.03” at Hill City, 0.04” at Goodland, and 0.07” at Russell. A few of the storms produced large hail; there were 33 reports of hail from 1 to 2 inches in diameter from the 5th through the 7th.
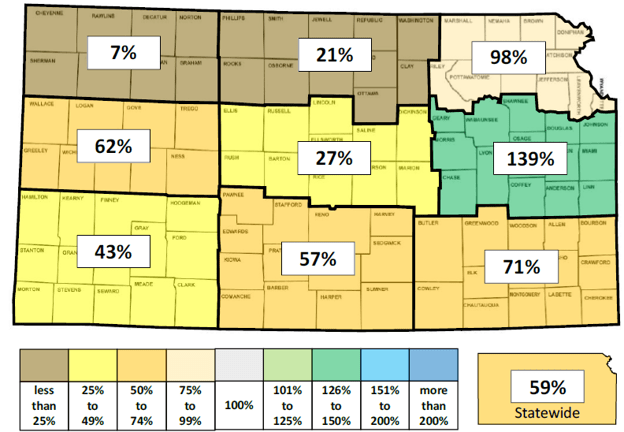
The statewide average precipitation for the 7-day period was 0.53”, 59% of the normal of 0.89”. Only one division averaged above normal: central Kansas, where the average of 1.30” was 139% of normal. Northeast Kansas’ average of 0.93” was close to, but slightly below, its weekly normal (98%). Northwest Kansas had the lowest average at 0.05”. The average statewide precipitation since April 1 is 17.23”, or 0.20” above normal. Four divisions are above normal, with east central (+5.84”) and northeast (+5.72”) the most ahead. Northwest (-2.83”) and southwest (-2.61”) Kansas are the most below normal divisions. For the year to date, the average statewide precipitation is 19.76”, or 1.02” below normal. East central is most ahead (+7.20”) while northwest (-4.01”) and southwest (-3.93”) are furthest behind. Around 57% of the state is below normal for the year, 4% more than last week. About 32% of the state is at least 2 inches above normal, while 43% of the state is at least 2 inches below normal.
Agricultural:
Weekly evapotranspiration (ET) for grass, estimated from Kansas Mesonet data, averaged 1.70”, or 0.29” above the normal of 1.41”. Divisional average ET totals ranged from 1.26” in northeast to 2.19” in southwest Kansas. Departures from normal ranged from -0.04” in northeast to +0.67” in southwest Kansas. Since April 1, total ET across Kansas has averaged 27.62”, or 1.45” above normal. Northeast Kansas’ seasonal ET total is slightly below normal (-0.26”), while the remaining eight divisions are all above average. Southwest Kansas’ total ET is most above normal (+3.70”).
There was an average of 189 growing degree days (GDD) for the week. This was 12 above the normal of 177. Divisional averages ranged from 171 in northwest to 204 in southeast Kansas. Divisional departures ranged from +6 to +19. Since April 1, the state has averaged 2,693 GDD, or 217 above normal. Seasonal departures range from +167 in the northwest to +268 in south central Kansas.
The statewide average 2” soil temperature for the week fell 0.6° to 80.7°. This average is 1.3° above normal. Divisional averages ranged from 78 to 84 degrees, lowest in the northeast and highest in the southwest. Solar radiation averaged 76% of maximum this past week, slightly below the normal of 78 percent. August 5 had the lowest amount at 51%, while four days exceeded 85 percent. August 8 and 9 were highest at 87 percent of maximum.
The average 2-meter wind speed for the period was 6.4 mph, above the normal of 5.1 mph. Daily average wind speeds ranged from 5 to 8 mph. South (37%) was the prevailing wind direction, based on 5-minute wind reports from the Kansas Mesonet.
The average dew point across the state was 63.0°, near the normal of 63.1°. Dew points averaged in the mid-50s across western Kansas, in the mid-60s in central Kansas, and around 70 in eastern Kansas. The highest dew point recorded by the Kansas Mesonet was 80° at Hiawatha on August 9.
Drought:
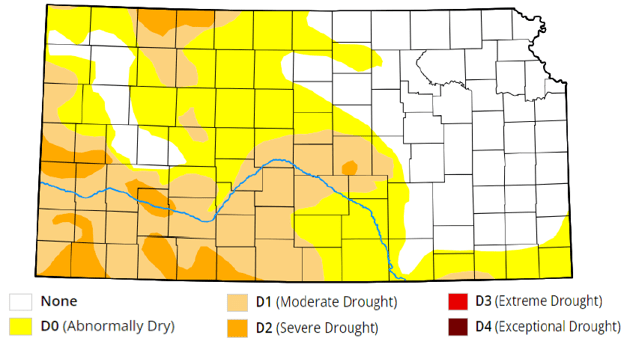
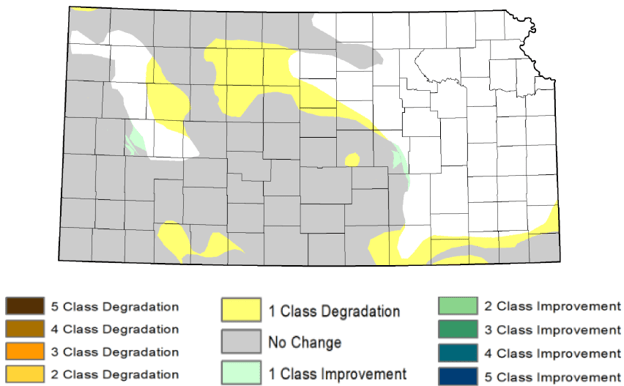
In the August 11 update of the US Drought Monitor map, the only good news was two small areas of one-category improvement. The first includes portions of Marion and Butler Counties where heavy rain fell. The second is in the Scott City area, again a fortunate recipient of significant precipitation. Most changes made to the map this week were one-category degradations. A small area of D2 was introduced in McPherson County. The existing D2 area along the Oklahoma border was expanded north, adding new areas of Comanche, Clark, Meade and Gray Counties. D0 was expanded northward in southeastern Kansas, with a new area of D1 introduced in Chautauqua and Montgomery Counties. Parts of 11 counties in north central Kansas are now covered by a new area of D0, including the communities of Hays, Plainville and Osborne. Much of Sheridan County is back in D0, the result of a westward expansion of an existing area of D0. Finally, a new area of D1 was added across northern Cheyenne County. Collectively, these changes resulted in a 10-point increase in Kansas’ Drought Severity and Coverage Index (DSCI), which now stands at 101, ending a 6-week run of DSCI indices under 100. The percentage of Kansas in drought (D1 or worse) rose slightly from 31.8% to 32.0%. The percentage of the state free of any drought status fell 9% from 46.6% to 37.6%.
Forecasts:
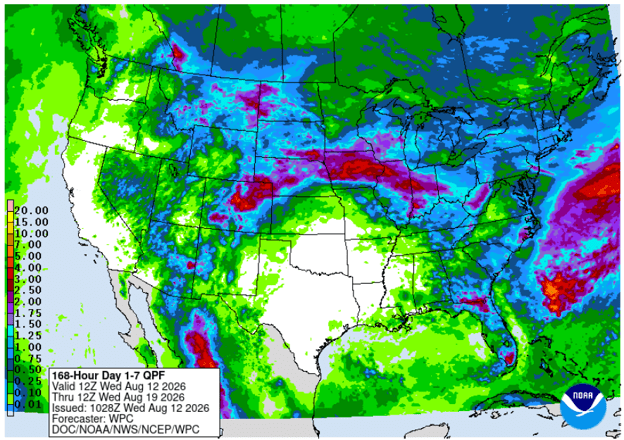
The Weather Prediction Center’s 7-day precipitation forecast, issued on Wednesday morning and valid for the period August 12 through 18, calls for the highest precipitation in far northwestern Kansas, where 1 to 2 inches of rainfall is possible. A persistent area of high pressure to the south and east of Kansas is likely to prevent any organized areas of significant rainfall for most areas. Below normal amounts are expected, and parts of south central and southeast could miss out entirely on precipitation. Average precipitation for the forecast period is 0.70” in western, and 0.86” in central and 0.95” in eastern Kansas. The same high pressure system will lead to very hot conditions persisting in most areas. Temperature are expected to average from 5 to 10 degrees above normal, with the hottest temperatures early in the period followed by a gradual cooldown. The average daily high and low for the 7-day period are 90° and 65°, respectively.
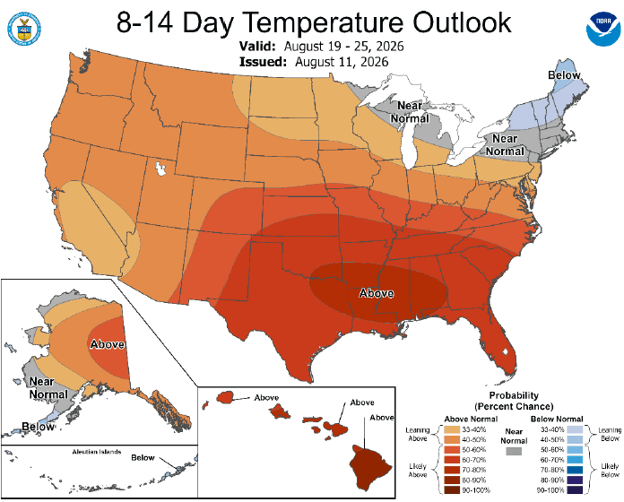
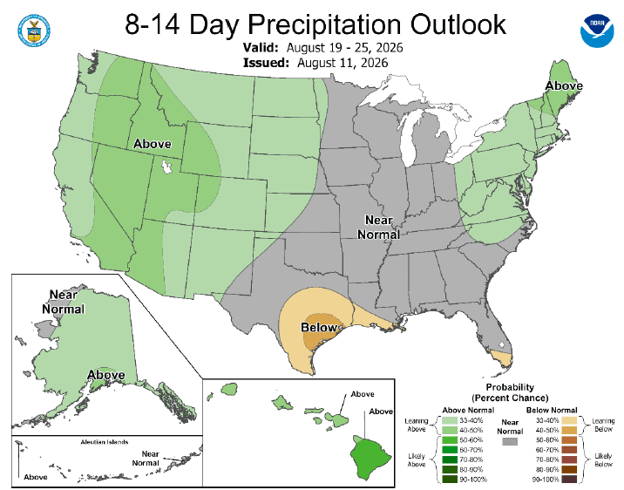
In the slightly longer term, the 8- to 14-day outlook, valid for the period August 19 through 25, above normal temperatures are likely statewide. The probabilities of above normal temperatures range from 52% in northwest to 65% in southeast Kansas. Above normal precipitation is slightly favored across much of western Kansas, with near normal precipitation favored in the east. The highest probability for any single outcome is only 36%, indicating a low confidence forecast.
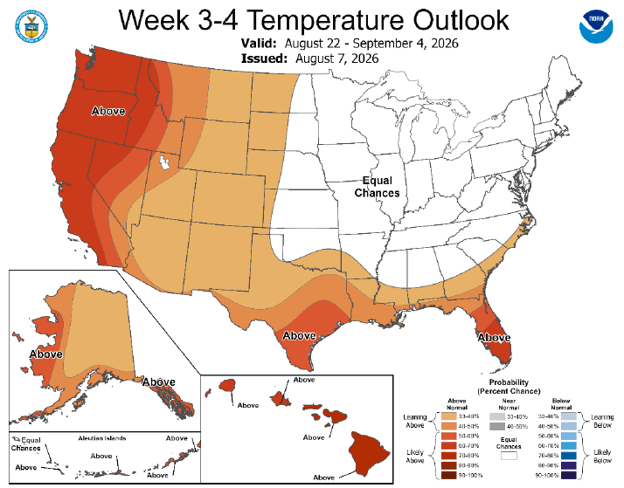
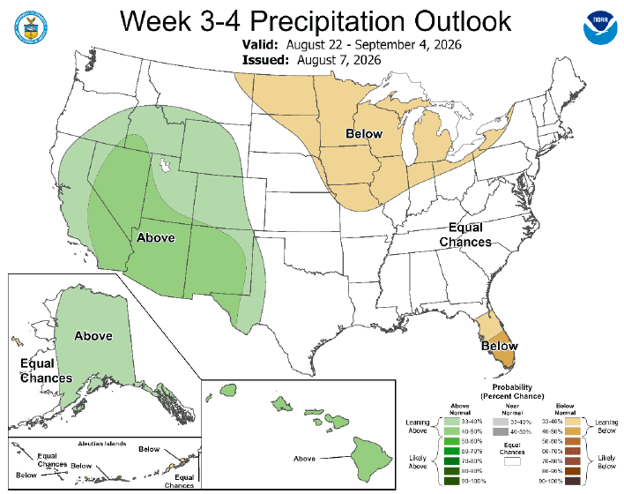
Looking even further ahead, the Climate Prediction Center’s weeks 3 and 4 outlook, issued on August 7 and valid for the 14-day period from August 22 through September 4, slightly favors (33 to 40 percent) above normal temperatures across far western Kansas. Outside of this area, the remainder of the state has equal chances for above, below and near normal temperatures. Nearly all of Kansas has equal chances for above, below and near normal precipitation, but there are slightly elevated chances (33 to 40 percent) for below normal precipitation across extreme northeastern Kansas.
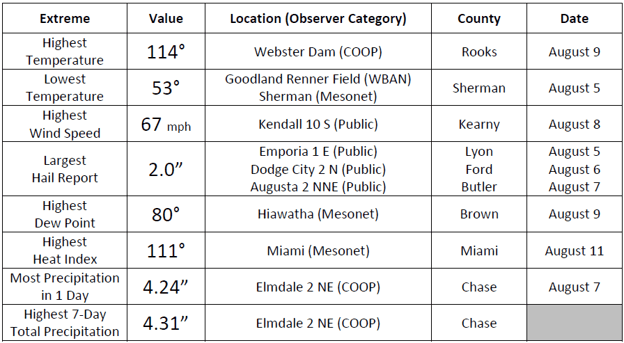
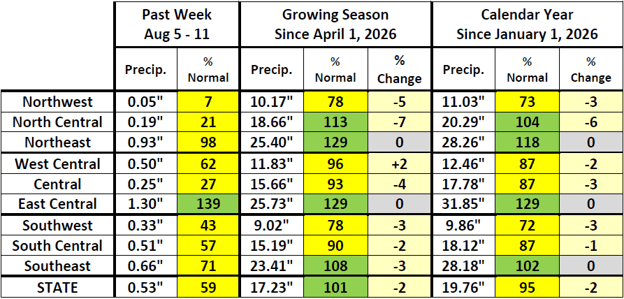
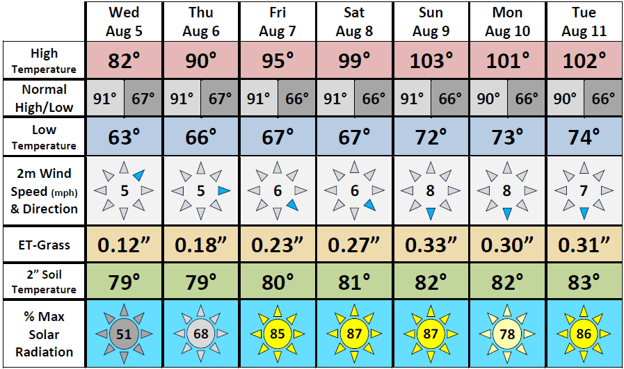
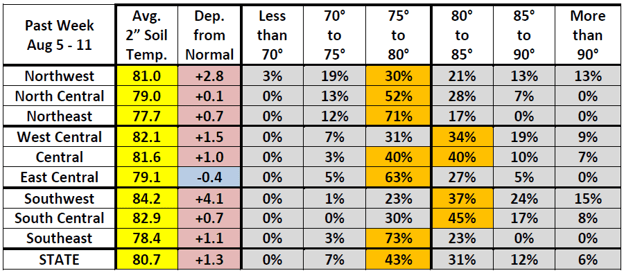
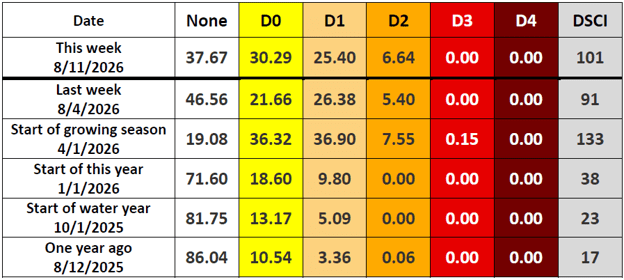
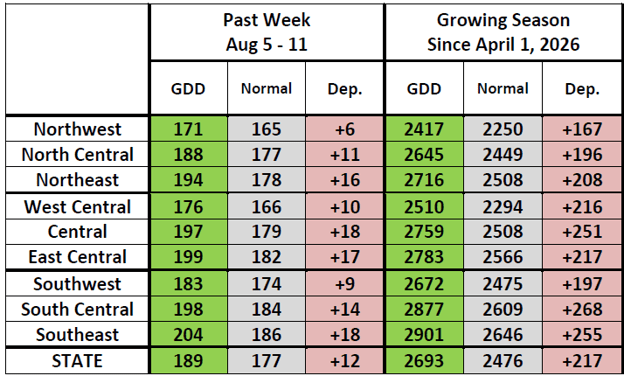
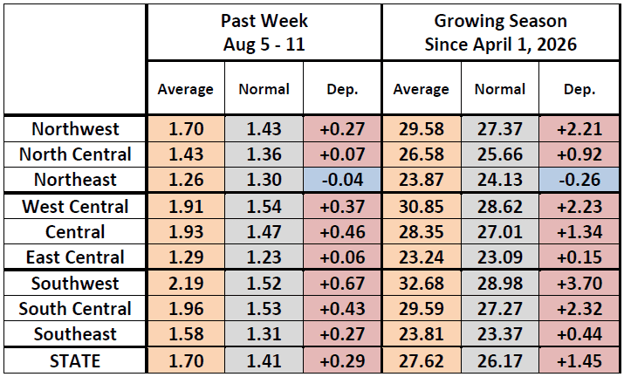
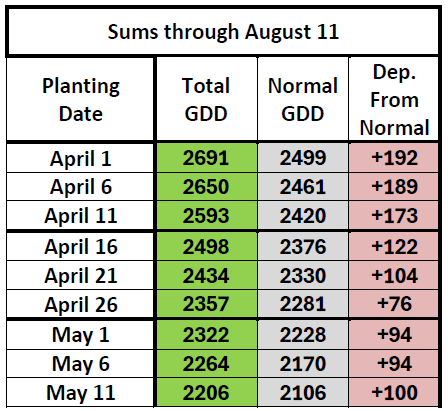
Table 8. Average number of accumulated growing degree days in Kansas since the start dates listed in the leftmost column, along with the departures from normal, based on data from the Kansas Mesonet. Unlike Table 6, the normals listed here are based on the nearest NCEI data to each Mesonet site; there will be slight differences in the statewide normals between the two tables.
–
The following has been adapted for a turf and landscape audience from the Weekly Climate Report for the week ending August 4, 2026. For the complete, unedited agronomic report, reach out to Matthew Sittel at msittel@ksu.edu.