KSU Weekly Climate Report: Week Ending July 14, 2026
KSU Weekly Climate Report: Week Ending July 14, 2026
By Teresa Roberts
Wednesday, July 22, 2026
Check out this week’s Kansas Climate Report and Drought Update from K-State Assistant State Climatologist, Matthew Sittel, summarized for a turf and landscape audience. It covers the 7-day period ending July 14, 2026. While the short-term forecast has since passed, the report’s rundown of recent temperature, rainfall, and drought is a useful snapshot of conditions as we continue into late July.
–
Kansas Climate Report – Week ending July 14, 2026
Original report by Matthew Sittel, Assistant State Climatologist
Temperature:
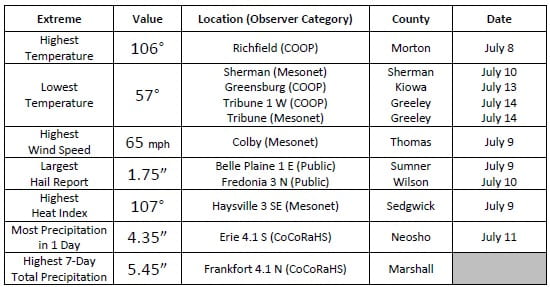
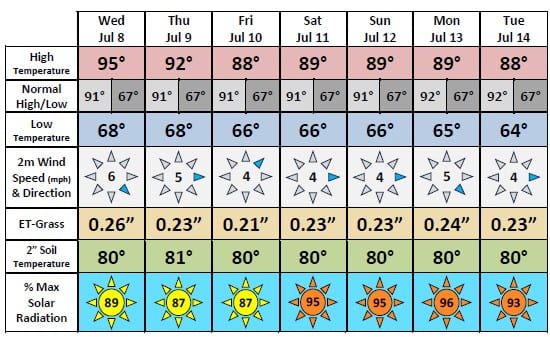
The hottest days of the week were at the beginning of the period. Both July 8 and 9 had average highs in the 90s, with July 8 the warmer of the two at 95 degrees. A few highs over 100 were recorded both days. Richfield’s high of 106° on July 8 set a new high mark for 2026 by one degree. Slightly cooler daytime highs were the rule from July 10 through 14, averaging in the upper 80s each day. Lows averaged in the upper 60s on July 8 and 9 and in the mid-60s thereafter through the end of the period. Normal highs are in the low 90s this time of year; the predominance of 80s during the week led the cool team to victory: a 5-2 win over the warm team in terms of number of days below versus above average during the period. The cool team will enter the coming period on a 5-day winning streak, as each day since July 10 has been below normal.
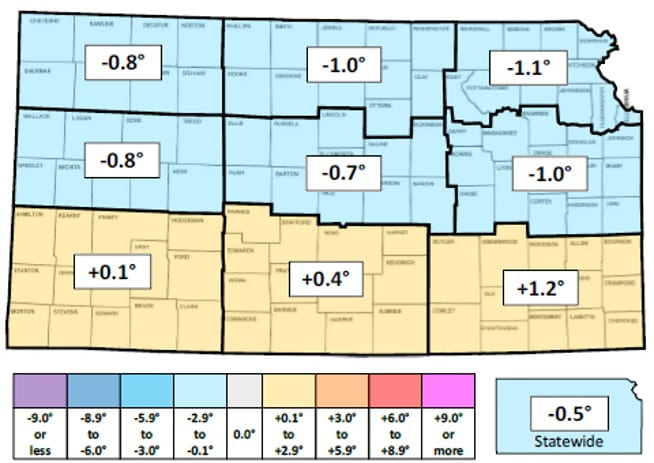
The statewide 7-day average temperature was 78.5°, or 0.5° below normal. The three southern divisions averaged above normal while the northern two-thirds of the state were below normal. Divisional departures ranged from -1.1° in the northeast to +1.2° in the southeast. Through the first two weeks of July, the average temperature is 78.6°, or 0.1° below normal. Eight of the first 14 days have averaged below normal. No single day has been more than three degrees above or below average this month.
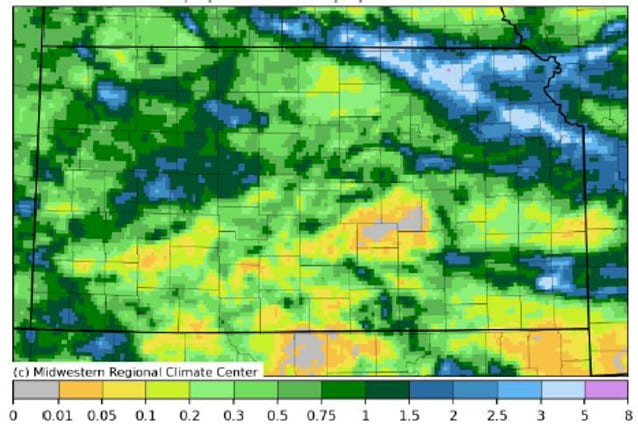
Precipitation: Most of the precipitation fell during the first half of the period. Showers and thunderstorms formed across eastern Nebraska on the evening of July 8 and tracked south into Kansas during the overnight hours. Marshall County received the most rainfall; nine CoCoRaHS observers recorded at least 3 inches of rain, with the highest total 4.20” north of Frankfort. The Kansas side of the Kansas City metropolitan area fared well too, with 1 to 2-inch totals in Wyandotte and Johnson Counties, with a few amounts around 2.5 inches near the border of those two counties. West central Kansas received from 1 to 2 inches of rain the following evening as a line of storms tracked out of eastern Colorado and moved east through the area. Two CoCoRaHS observers in Dighton in Lane County measured around 2.4” of rain. July 10’s rainfall focused on two separate areas: the far northeast and far southeast. Showers and storms moved out of Nebraska into the border counties from Marshall east to Doniphan during the late morning and early afternoon hours. Brown County was most impacted, with two observers west of Hiawatha reporting from 3.7 to 3.8 inches of rain. More showers and thunderstorms formed during the evening of July 10 along a line from Eureka to Pittsburg. The storm motion was to the east, which resulted in training cells dumping copious amounts of rainfall in this area. A CoCoRaHS observer south of Erie in Neosho County measured 4.35” of rain from the storms. Despite this high total, below normal totals were the rule across most of southern Kansas. In the southwest, Dodge City only received 0.14” for the week, while Ulysses measured 0.24” and Garden City had 0.30”. In south central Kansas, Greensburg only received 0.02”. Hutchinson (0.12”) and Wichita (0.19”) had less than one-quarter inch for the week. Finally, areas in southeast Kansas south of the line of storms on July 10-11 missed out as well; both Parsons Airport and Coffeyville Water Works had just 0.11” for the week.
There were a few reports of severe weather during the period. No tornadoes were observed, but there were 11 reports of severe hail at least 1” in diameter. The largest hail report was 1.75” in Sumner County on July 9 and in Wilson County on July 10. There were 55 reports of severe wind gusts of at least 58 miles per hour. The highest report was 90 mph in Sherman County north of Edson on July 9. Five of the 55 gusts were recorded at Kansas Mesonet sites; the highest was 65 mph at Colby on July 9.
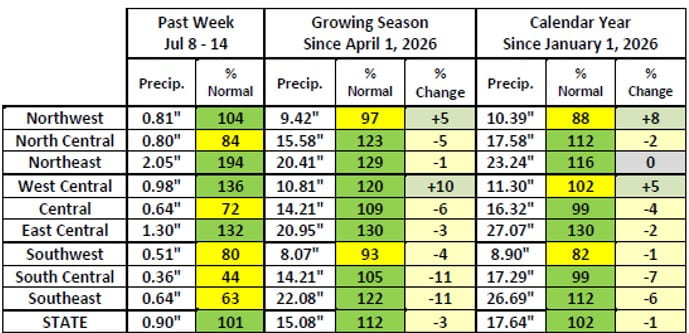
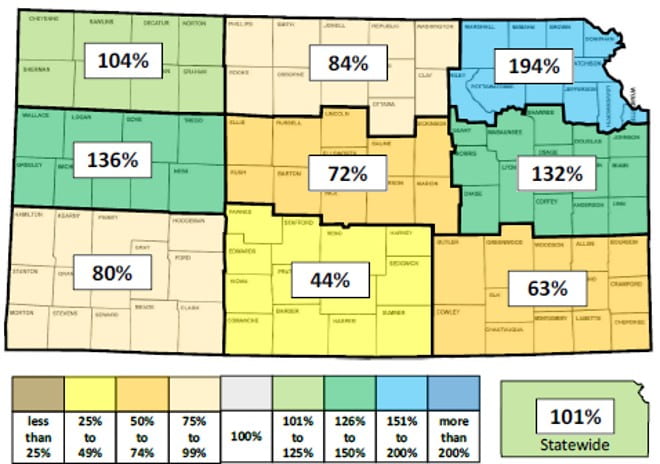
The statewide average precipitation for the 7-day period was 0.90”, or 0.02” above the normal of 0.88”. Four divisions were above normal this week, led by northeast Kansas with an average of 2.05” (194% of normal). East central was next highest, averaging 1.30” of rainfall. South central had the lowest average at 0.36”. The average statewide precipitation since April 1 is 15.08”, or 1.61” above normal. Northwest and southwest are the only below normal divisions, but their deficits are less than one inch. The three eastern divisions are all 4 to 5 inches above normal, with east central the most ahead at +4.82”. For the year to date, the average statewide precipitation is 17.64”, a departure from normal of +0.42”. Above normal divisions outnumber the below 5 to 4. East central is most ahead (+6.18”) while southwest is furthest behind (-1.93”). Around 62% of Kansas is running above normal for the year. About 41% of the state is 2 inches or more above normal, while 24% of the state is at least 2 inches below normal.
Agricultural:
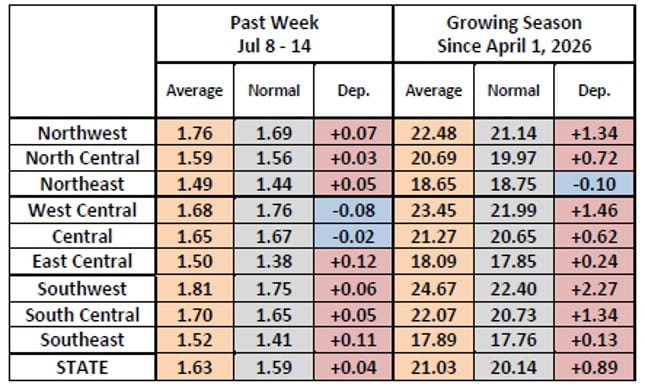
Weekly evapotranspiration (ET) for grass, estimated from Kansas Mesonet data, averaged 1.63”; this is 0.04” above normal. Divisional average ET totals ranged from 1.49” in northeast to 1.81” in southwest Kansas. West central and central Kansas’ averages were slightly below normal while the other seven divisions were slightly above; divisional departures ranged from -0.09” in west central to +0.12” in east central Kansas. Since April 1, total ET across Kansas has averaged 21.03”, or 0.89” above normal. Northeast Kansas’ seasonal ET total is slightly below normal (-0.10”) while all other divisions are above normal. Southwest Kansas’ total ET is most above normal (+2.27”).
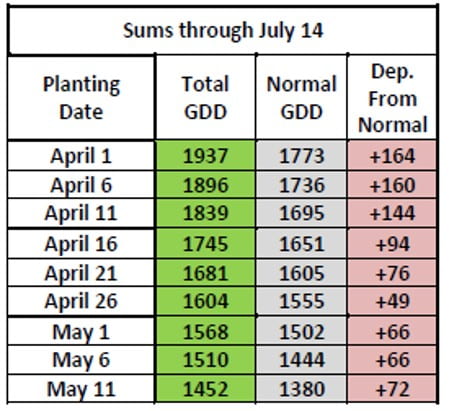
There was an average of 182 growing degree days (GDD) for the week. This was 2 above the normal of 180. Divisional averages ranged from 173 in northwest and west central to 195 in southeast Kansas. Divisional departures ranged from -2 in northeast to +7 in southeast Kansas. Since April 1, the state has averaged 1,939 GDD, or 182 above normal. Seasonal departures range from +140 in the northwest to +222 in south central Kansas. Seasonal departures based on planting dates are above normal at all five-day interval dates from April 1 through May 11, highest for those dates closer to April 1.
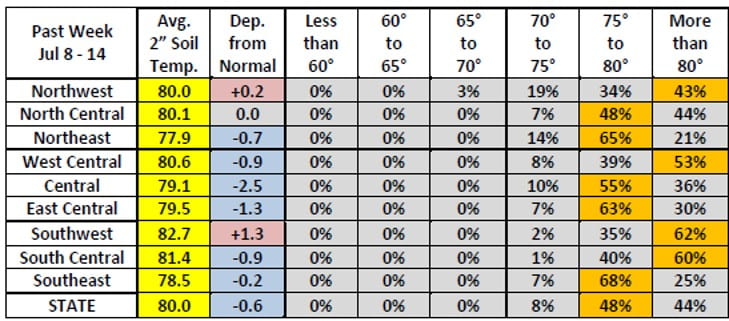
The statewide average 2” soil temperature for the week rose 1.5° to 80.0°. This average is 0.6° below normal. Divisional averages ranged from 78 to 83 degrees, lowest in the northeast and highest in the southwest. Solar radiation averaged 92% of maximum this past week. The normal for this time of year is 82%. All seven days were above normal, ranging from 87% (July 9 and 10) to 96% (July 13).
The average 2-meter wind speed for the period was 4.7 mph, below the normal of 5.5 mph. All days averaged between 4 and 6 mph, with July 8 the highest at 5.9 mph. East was the prevailing wind direction, recorded 32% of the time. Southeast was the next highest at 28 percent. South, often the prevailing wind direction in summer, was recorded just 10% of the time. These percentages are based on 5-minute wind reports from the Kansas Mesonet.
It was slightly more humid than usual during the week. The average dew point across the state was 65.2°, above the normal of 63.8°. Dew points averaged in the low 60s across western Kansas, in the mid-60s in central Kansas, and in the upper 60s in eastern Kansas.
Drought:
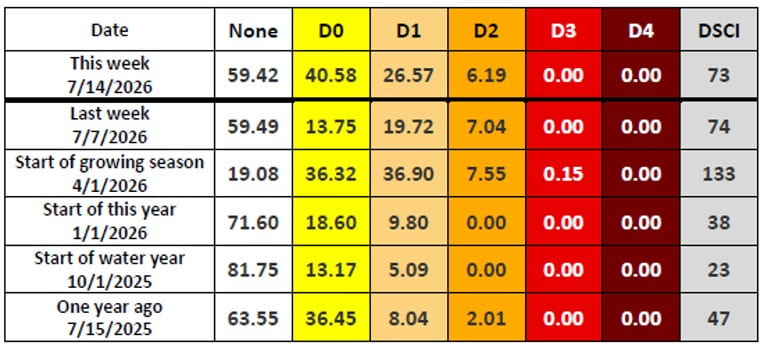
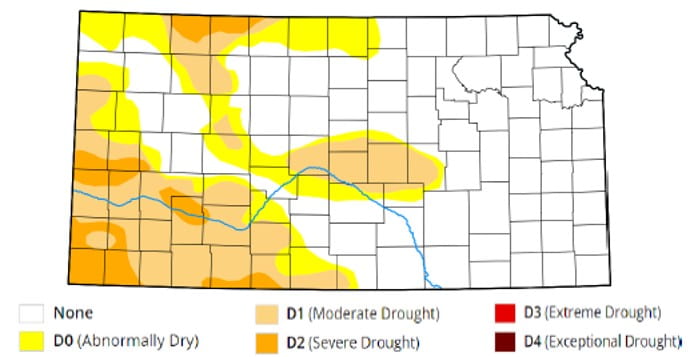
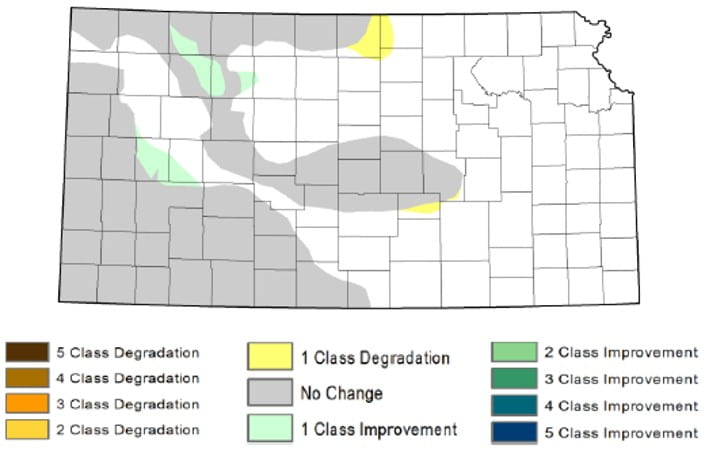
There were only a few minor adjustments to Kansas’ drought categories in the July 14 update of the US Drought Monitor. One-category improvements were made to parts of nine counties in western Kansas, including in the Scott City area. One-category degradations were made in portions of seven counties in central Kansas. These changes mostly balanced each other out; the percent of Kansas free of any drought status remains at 59%. Around 27% of Kansas is still in drought (D1 or worse). The composite Drought Severity and Coverage Index (DSCI) fell 1 point to 73. This is the lowest DSCI in four months.
Forecasts:
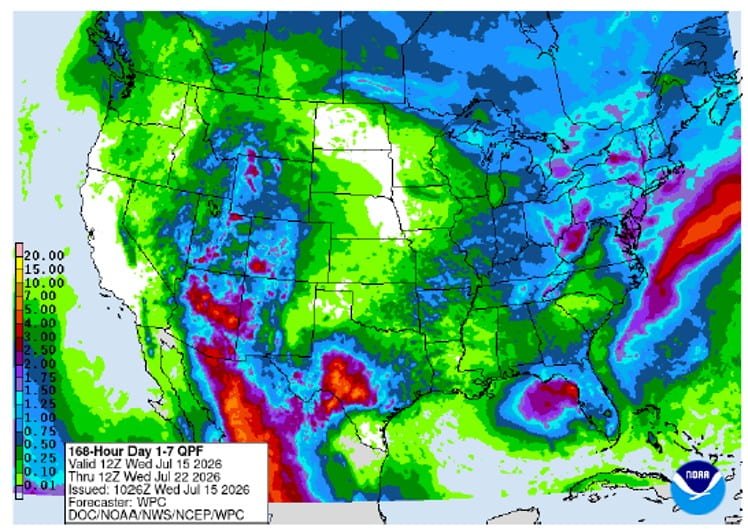
The Weather Prediction Center’s 7-day precipitation forecast, issued on Wednesday morning and valid for the period July 15 through 21, calls for below normal precipitation in all areas. Most locations are expected to receive no more than one-tenth of an inch of precipitation. Northwest and southeast Kansas could fare slightly better and pick up as much as one-half inch. Average precipitation for the forecast period is 0.75” in western, 0.91” in central and 0.97” in eastern Kansas. Temperatures are expected to average around 2 degrees above normal. July 19 and 20 are expected to be the warmest days of the period, with highs approaching 100 degrees in many areas both days. The average daily high and low for the 7-day period are 92° and 67°, respectively. Both of these are near the annual maximums for Kansas.
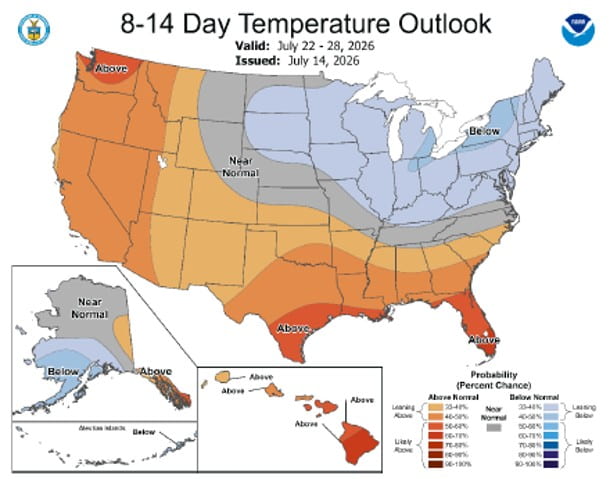
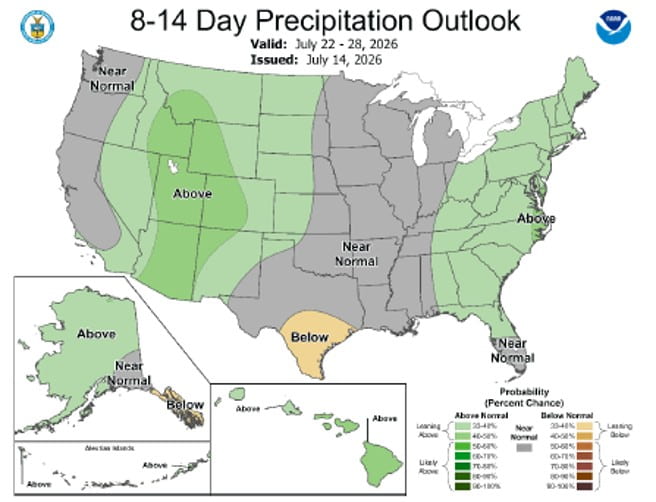
In the slightly longer term, the 8- to 14-day outlook, valid for the period July 22 through 28, slightly favors above normal temperatures across southern Kansas, with probabilities as high as 37 percent in southeast Kansas. Near normal temperatures are slightly favored across the northern half of the state. There are slightly elevated chances for above normal precipitation in the western half of Kansas, with the highest probability of 37% along the Kansas-Colorado border. Near normal precipitation is favored in the eastern half of the state. All precipitation probabilities are only slightly above equal chances and should be considered low confidence forecasts.
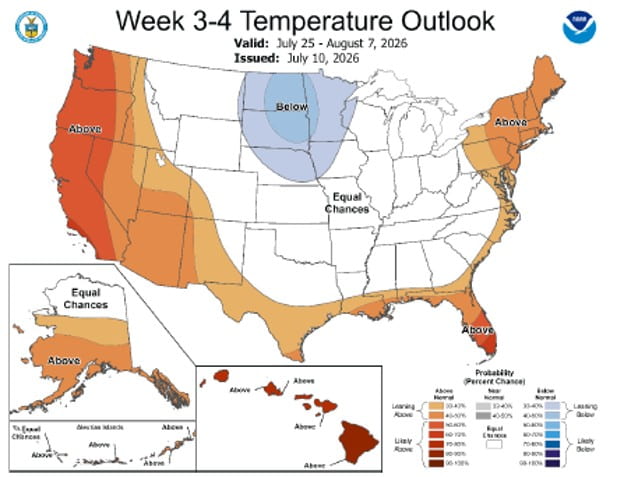
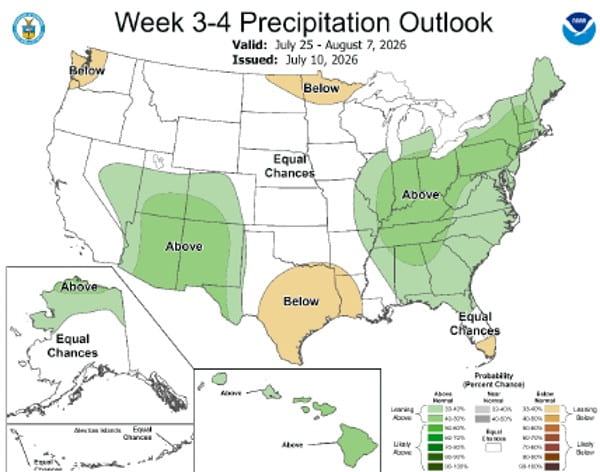
Looking even further ahead, the Climate Prediction Center’s weeks 3 and 4 outlook, issued on July 10 and valid for the 14-day period from July 25 through August 7, calls for equal chances of above, below and near normal temperatures. All of Kansas also has equal chances for above, below and near normal precipitation.
Table 1. Temperature, precipitation and wind extremes across Kansas during the 7-day period.Table 2. Weekly, water year and calendar year average precipitation estimates, percent of normal and 7-day change to percent of normal for the state and each of Kansas’ climate divisions.Table 3. Average statewide daily climate data from the Kansas Mesonet for selected variables. ET-Grass is the average daily evapotranspiration at each Mesonet site. Wind direction listed is the compass point with the highest count of daily observations. Solar radiation is the average percentage of maximum possible sunshine.Table 4. Divisional seven-day average 2” soil temperatures (in °F), their departures from normal, and the percent of time during the period that soil temperatures were within the listed five-degree ranges. The orange-shaded cells are the highest percentages within each division.Table 5. US Drought Monitor categorical data for the state of Kansas. Numbers indicate the percent of the state in each category. D4 is the most severe category, while D0 is the least severe. None refers to drought-free conditions. DSCI is the Drought Severity Coverage Index, a composite index of overall drought conditions. Higher DSCI values indicate worse drought. The DSCI can range from a minimum of 0 (entire state drought-free) to 500 (entire state in D4).Table 6. Weekly and growing season-to-date evapotranspiration (ET), in inches, averaged for the state and each of Kansas’ nine climate divisions, based on data from the Kansas Mesonet.Table 7. Average number of accumulated growing degree days in Kansas since the start dates listed in the leftmost column, along with the departures from normal, based on data from the Kansas Mesonet. Unlike Table 6, the normals listed here are based on the nearest NCEI data to each Mesonet site; there will be slight differences in the statewide normals between the two tables.
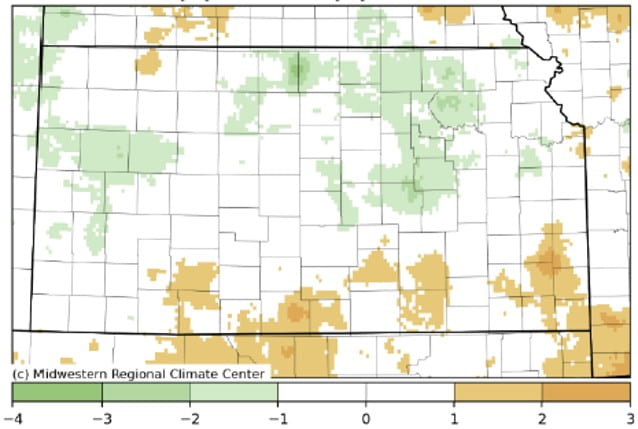
Figures 1a-b. Total precipitation (inches, top) and departure from normal temperature (°F, bottom) for the 7-day period (Sources: SRCC, HPRCC). (Note: these images occasionally contain erroneous data points which can significantly affect the contours.)
Figures 2a-b. This week’s departure from normal temperature (°F, top) and percent of normal precipitation (bottom) by Kansas climate division.
Figures 3a-b. Current weekly drought status (top) and change in category over the past week (bottom) for Kansas (Source: U.S. Drought Monitor).Figure 4. The National Weather Service Weather Prediction Center’s (NWS-WPC) 7-day precipitation forecast.
Figures 5a-b. The National Weather Service Climate Prediction Center’s (NWS-CPC) 8 to 14-day temperature (top) and precipitation (bottom) outlooks.
Figures 6a-b. The Climate Prediction Center’s weeks 3 and 4 outlooks for temperature (top) and precipitation (bottom).
The following has been adapted for a turf and landscape audience from the Weekly Climate Report for the week ending July 14, 2026. For the complete, unedited agronomic report, reach out to Matthew Sittel at msittel@ksu.edu.