KSU Climate Survey for June
Check out the Kansas Climate Summary for June 2026 from K-State Assistant State Climatologist, Matthew Sittel.
The report offers a useful snapshot of the conditions your clients and crews have been working through, including recent temperature and precipitation patterns by region, drought status changes, growing degree days, and evapotranspiration data that can inform irrigation and plant stress decisions.
It also includes the outlook for July, which can help with planning ahead for watering schedules, disease/pest pressure, and heat or moisture stress on turf and landscape.
–
Kansas Climate Summary June 2026
By Matthew Sittel, Assistant State Climatologist
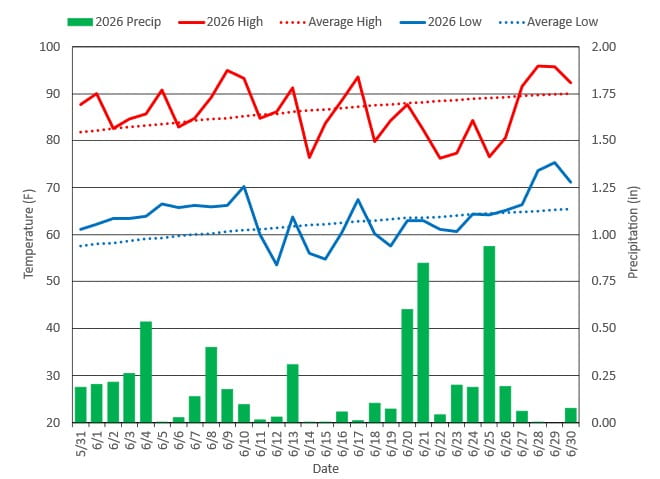
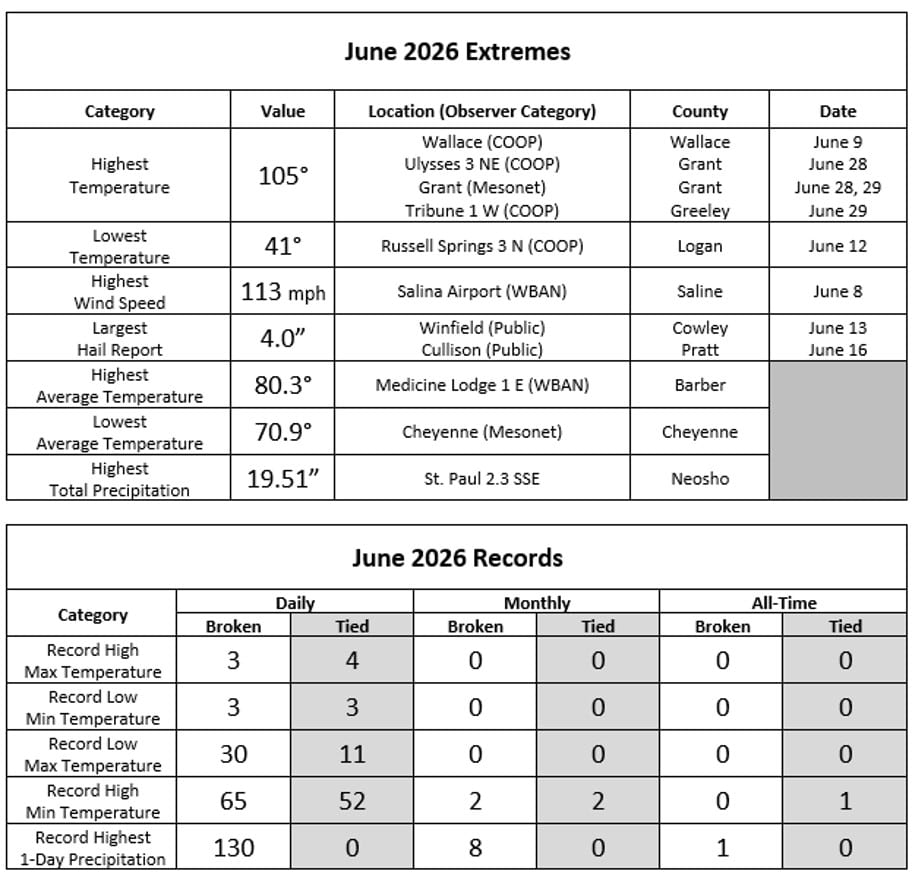
June was the tenth consecutive month with above normal temperatures, although the continuation of the longest string of such months in more than a decade was uncertain until month’s end. The first ten days of June were all above normal, collectively averaging five degrees above average. But a persistent period of below normal conditions at mid-month erased this overage, and by June 26, the month was averaging exactly normal. A return to above average temperatures commenced on June 27 and lasted through month’s end, tipping the scales in favor of above normal conditions. There were 10 days on which highs across the state averaged in the 90s, with June 28 and 29 the hottest averages at 96 degrees. At least twenty Kansas Mesonet sites reached 100° on each of those two days, as well as on June 9. The month’s hottest reading of 105° was recorded on each of these three dates at various locations across far western Kansas. Morning lows were generally in the 60s but averaged in the 70s on four days: June 10 and June 28 through 30. Cooler averages in the 50s were recorded on four days between June 12 and 19. The month’s coolest reading was 41° north of Russell Springs on June 12. There were no lows in the 40s observed after June 16; that morning, both the Sherman and Cheyenne Country Mesonet sites recorded lows of 48 degrees.
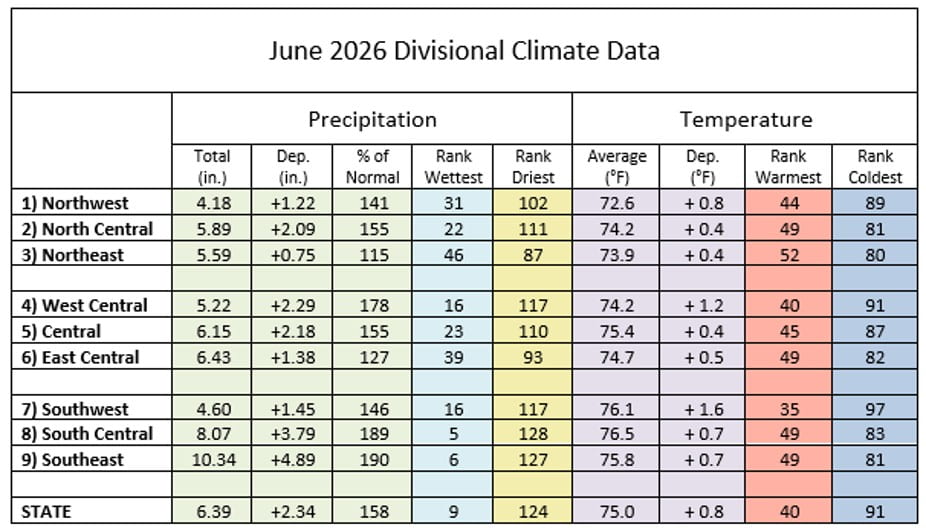
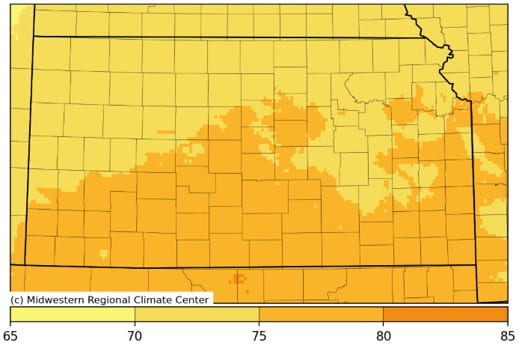
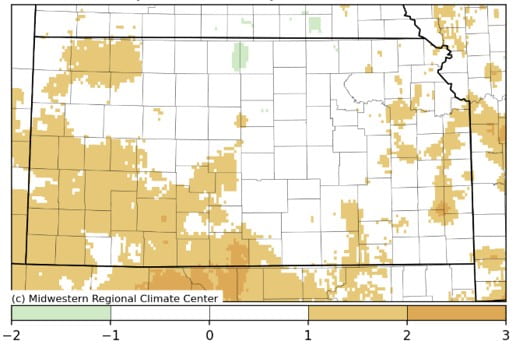
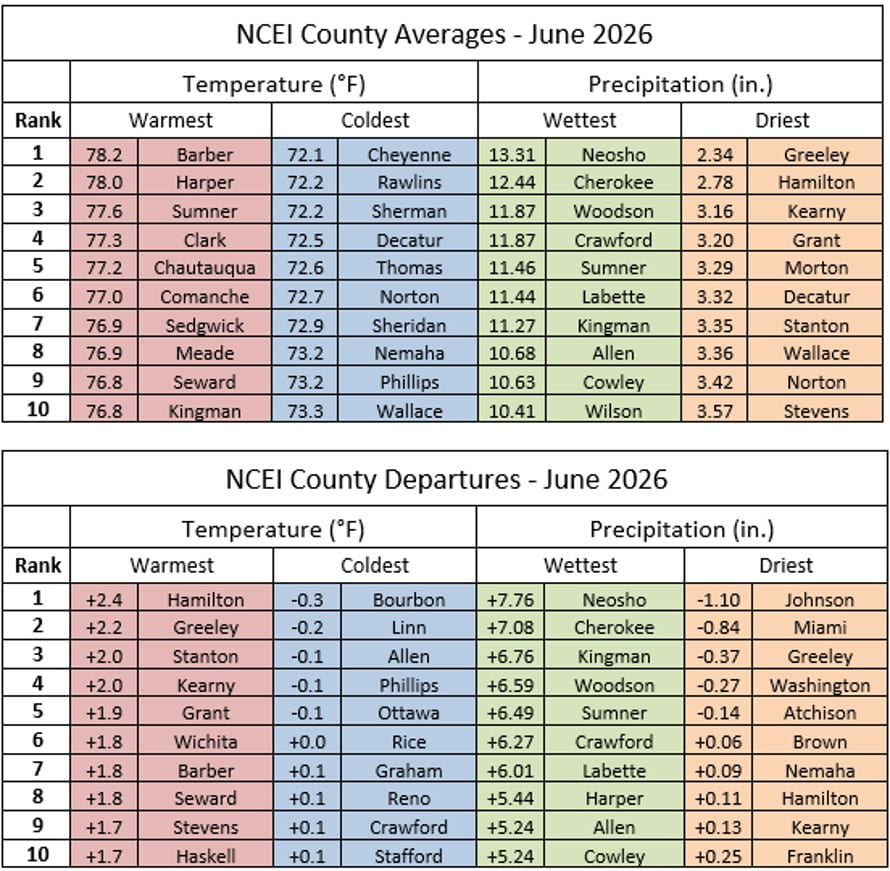
The statewide average temperature for June was 75.0°, or 0.8° above normal. This ranked as the 40th warmest June out of 132 years of NCEI data, dating back to 1895. Divisional departures from normal were all positive, ranging from +0.4° in three divisions (north central, northeast and central) to +1.2° in west central Kansas. Only five counties finished June below normal; Bourbon County was most below at -0.3°. Hamilton County was most above normal at +2.4°, one of four counties at least two degrees above normal. Average monthly temperatures within individual counties ranged from 72.1° in Cheyenne to 78.2° in Barber County.
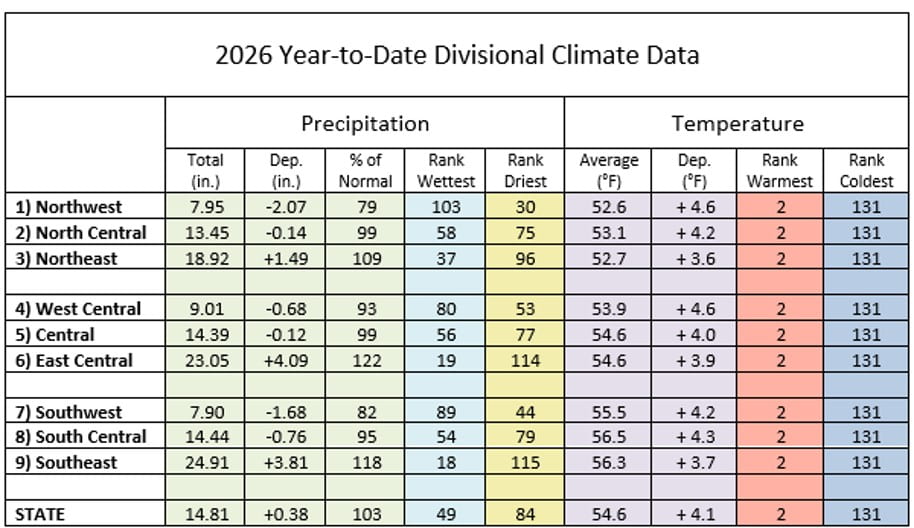
The state average temperature for the first half of 2026 was 54.6°, or 4.1° above normal. This is the second warmest January-June on record, behind only 2012 (55.7°). All divisions currently rank as second warmest behind 2012. There are 10 counties currently ahead of their 2012 average and rank as warmest first half of the year on record. An additional 85 counties rank second warmest, and nine more rank third warmest. Only Marshall County does not have a top 3 warmest year so far; they rank at 7th warmest. All counties are at least 3 degrees above normal for the first half of 2026. Wallace County is the most ahead of normal with a departure of +5.0 degrees.
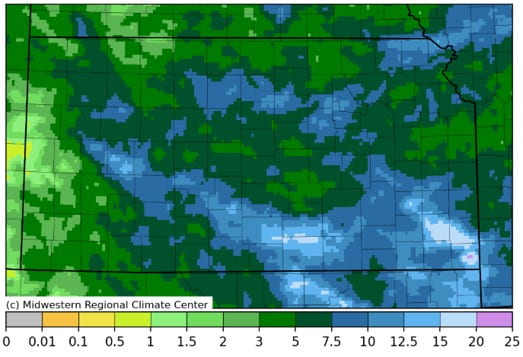
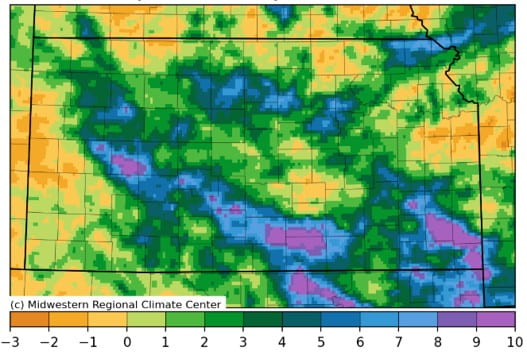
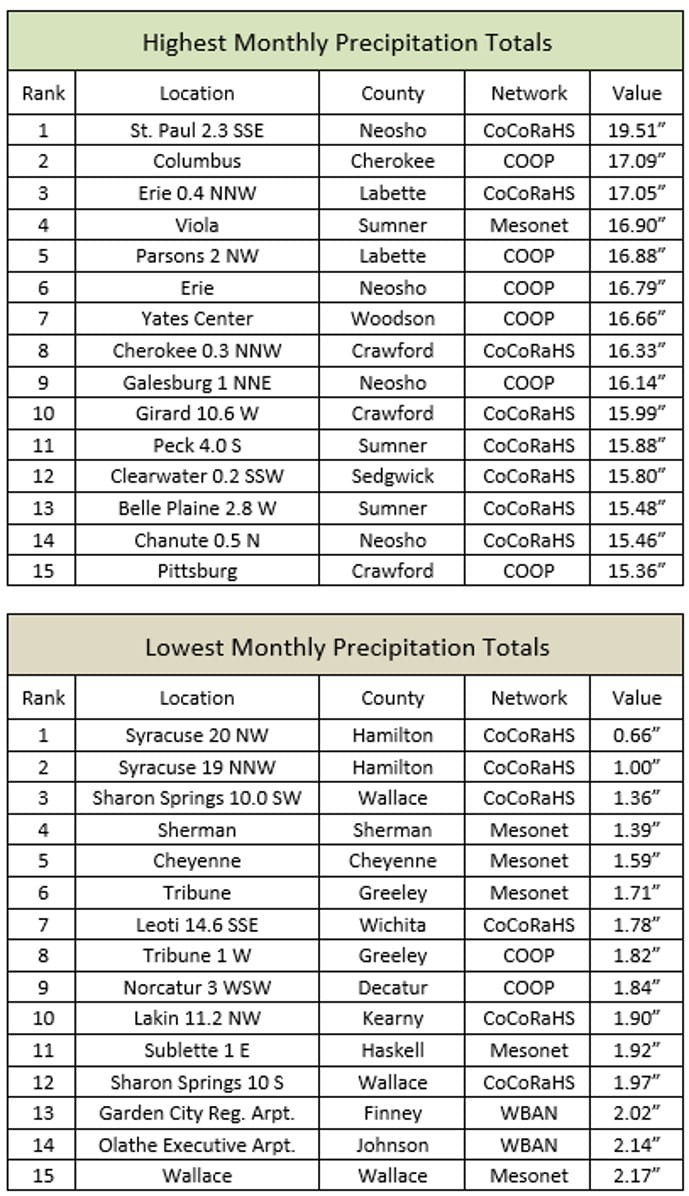
June precipitation averaged well above normal in much of the state. The highest total was an impressive 19.51” in Neosho County, measured by a CoCoRaHS observer near St. Paul. This was the highest June total in nearly two decades, since parts of southeast Kansas had over 20 inches of rain in 2007. Additionally, totals in excess of 16 inches were recorded by observers in Cherokee, Crawford, Labette, Sumner and Woodson Counties. The southern half of the Wichita metropolitan area was also very wet. More than two dozen CoCoRaHS observers across the southern half of Sedgwick County recorded from 10 to 15 inches of rain during June, the majority of which fell on two days: June 21 and 26. By contrast, parts of northern Sedgwick County had less than 5 inches of rain for the month. The official total for the city of Wichita was 12.37”; this ranks as their second wettest June on record behind 1923 (14.43”). A few other locations with wetter than normal Junes include Chanute (12.78”), Coffeyville (10.45”), Manhattan (8.69”), and Dodge City (7.46”). Some of the driest areas in June were in far western Kansas along the Colorado border. The CoCoRaHS observer 20 miles northwest of Syracuse in Hamilton County recorded only 0.66” for the month, the lowest total in the state. Kansas Mesonet sites in Sherman, Cheyenne and Greeley Counties all recorded under two inches of rainfall, with Sherman the driest at 1.39”.
The average monthly precipitation across Kansas for June was 6.39”, or 2.34” above normal. This ranks as the 9th wettest June in 132 years of records and was the wettest June since 2014. Within climate divisions, it was the 5th wettest June for south central Kansas, and 6th wettest for southeast Kansas. Every division was above normal; the lowest ranked division was northeast Kansas at 46th wettest. Neosho County was wettest, averaging 13.31” of precipitation, one of ten counties with an average of at least 10 inches of rain. Despite the high totals in these counties, only one of them had their wettest June on record: Kingman County, with an average precipitation of 11.27”. Ten counties had a top 5 wettest June, and fourteen more finished between 6th and 10th place. Neosho County was the most above normal at +7.76”, one of ten counties at least five inches above normal. Just over half of the state (53 of 105 counties) were at least two inches above normal for June. On the dry side, Greeley County had the lowest average at 2.34”; this was one of thirteen counties to finish below four inches. Only five counties averaged below normal, with Johnson County the most below at -1.10 inches. Miami (50th) and Johnson (52nd) ranked the highest on their list of driest Junes on record.
For the first half of the year, the state’s average precipitation was 14.81”, or 0.38” above normal. This ranks as the 49th wettest January-June on record. East central (18th) and southeast (19th) are the highest ranked divisions. The three eastern divisions are all above normal for the year, while the western and central divisions are below normal. Northwest is the most below normal (-2.07”) and has the highest ranking on its respective list of driest first halves of 2026: 30th driest. Eight counties are experiencing a top-10 wettest year to date, led by 7th place Lincoln and Neosho Counties. Neosho is the most above normal county (+8.61”), but in terms of total precipitation, it is second-wettest at 30.87”; Cherokee County is leading at 31.04”. Greeley and Morton are tied for the driest county, both averaging 6.38” for the year so far. Two counties have a top 10 driest year in progress: Norton (6th) and Decatur (10th). These counties are currently the 4th and 3rd driest in the state for the year, respectively. Norton County is the most below normal in the state at -4.60 inches. There is a near even split on above versus below normal counties: 53 are above normal and 52 are below normal.
Severe weather occurred during some of the precipitation events. Preliminary data from the Storm Prediction Center indicates 17 tornadoes occurred in Kansas during the month of June. There were also 115 reports of severe hail at least 1 inch in diameter, with 16 of these reports being 2” or larger. Most numerous were the 275 reports of severe wind gusts of at least 58 miles per hour. There were 38 gusts to at least hurricane force (74 mph), led by an incredible 113 mph report at the Salina airport on June 8. This resulted in many snapped power poles and twisted highway signs along Interstates 70 and 135.
The state averaged 708 growing degree days in June. This is slightly above the normal count of 680. Counts across the Kansas Mesonet ranged from 613 in Cheyenne County to 775 in Harper County. There were an average of 87 corn stress degree days in June, which is exactly normal. Total evapotranspiration (ET) across the state in June averaged 6.43”; normal for the month is 6.88”. Daily ET averaged at least 0.30” on three days and was highest on June 28 (0.34”). The average 2-meter wind speed across the state was 7.7 mph, above the normal speed of 7.0 mph for June. Six days had an average wind speed of 10 mph or greater, the highest of which was 13.6 mph on June 29. The most common wind directions during the month, based on hourly data from the Kansas Mesonet, were south (29%) and southeast (24%).
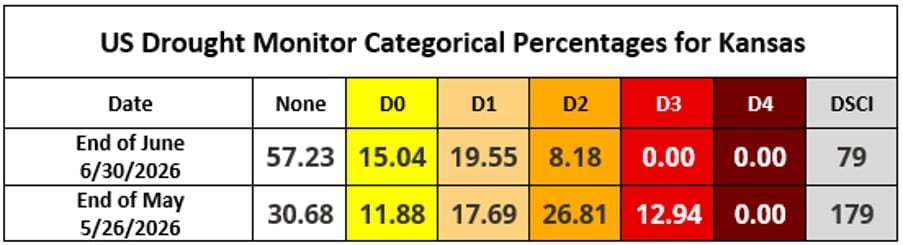
There were widespread improvements to areas in drought on the US Drought Monitor map in June. Nearly all of western Kansas was upgraded. A few areas were bettered by three categories, including the Colby and Hays areas. All of the D3 present at the start of June was removed. These collective changes reduced the percentage of the state in drought (D1 or worse) by roughly half, from 57 down to 28 percent. Similarly, the percentage of Kansas free of any drought status jumped from 31 to 57 percent. The composite Drought Severity Coverage Index (DSCI) fell 100 points from 179 to 79, signifying significant improvements to drought conditions during June.
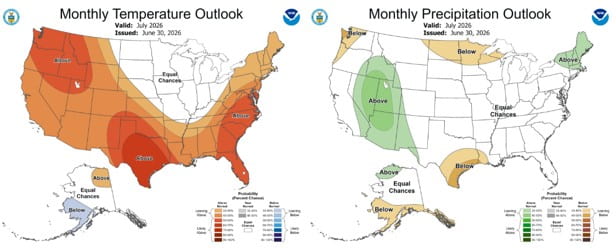
Looking ahead, the Climate Prediction Center’s outlook for July favors above normal temperatures across much of Kansas. The probabilities for a warmer than average month increase from northeast to southwest and exceed 50 percent in the far southwest. Precipitation is more uncertain; there are equal chances of above, below and near normal precipitation statewide. The average high and low during the month of July are 91° and 67°. Normal July precipitation averages 3.31” in western, 4.00” in central and 4.35” in eastern Kansas.
June 2026 Summary Data for Selected Kansas Locations
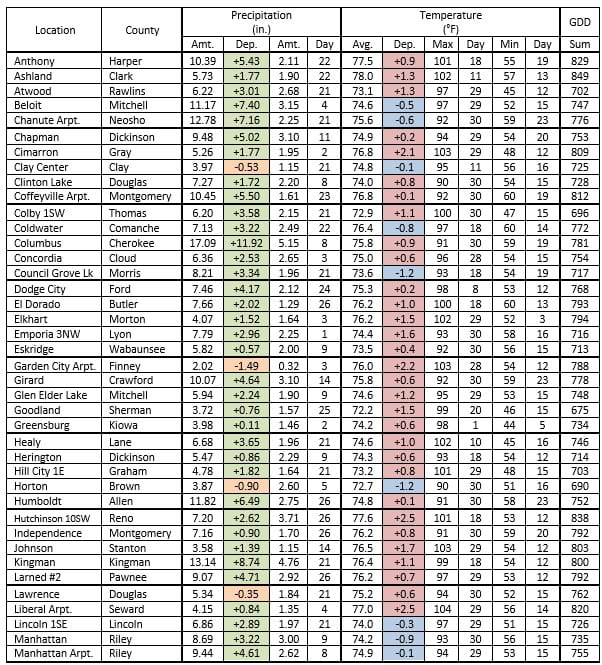
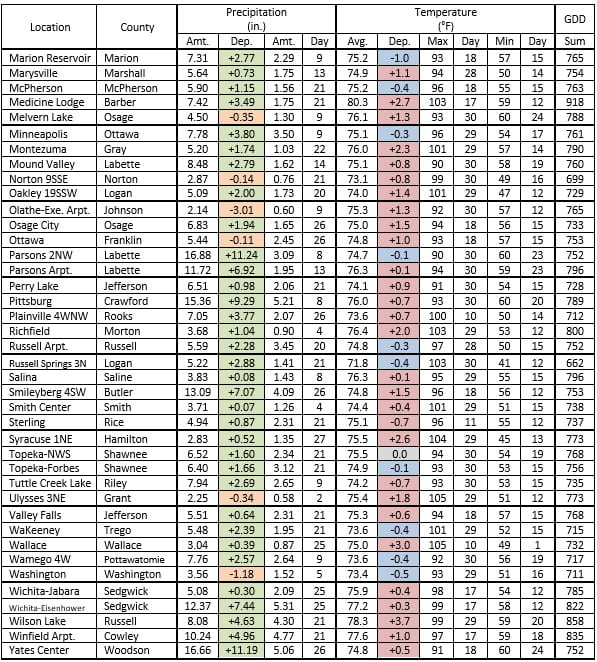
Data source: SC-ACIS. Normals based on 1991-2020 data from NCEI. If extreme occurred on multiple dates, only the last date of occurrence is listed. GDD refers to growing degree days (base 50°).
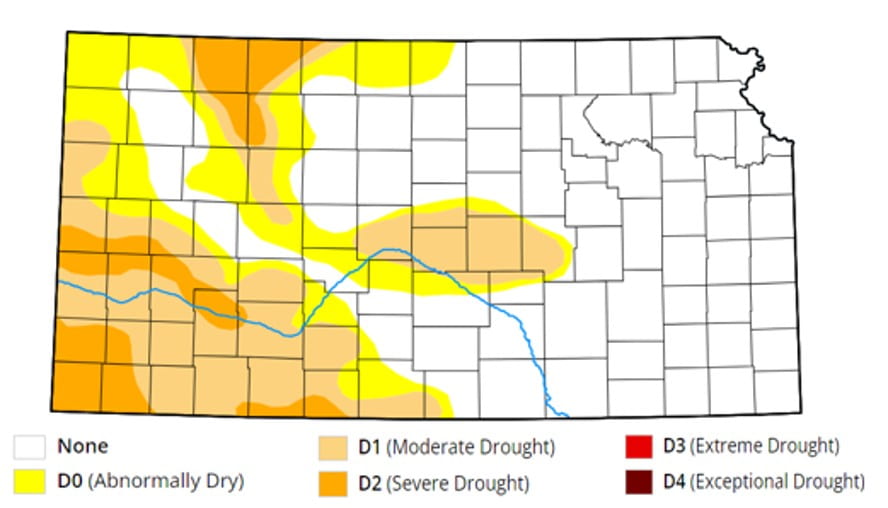
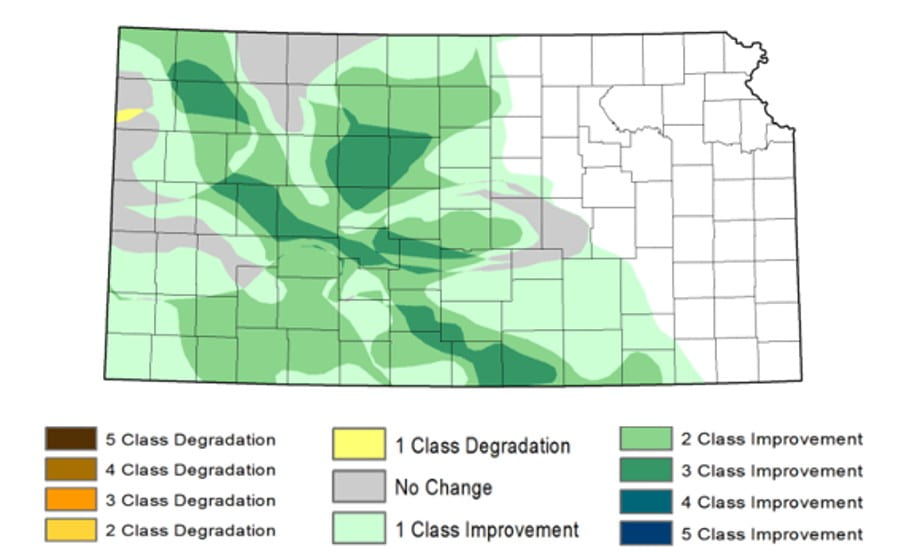
Figures 1a-b. Kansas’ most recent weekly drought status (top) and change over the past month (bottom) maps (Source: U.S. Drought Monitor, National Drought Mitigation Center).
To have the monthly Kansas Climate Summary sent directly to your inbox, reach out to Matthew Sittel at msittel@ksu.edu.