Building and Analyzing Node-Link Diagrams to Understand Social Networks
"Visual Complexity" (A Random Walk)
Node-link diagrams (or "graph drawing") come in a range of forms, with varying levels of complexity. These are so visually engaging and dazzling that it sometimes takes some doing to get past the look-and-feel and move to the substance...
By Shalin Hai-Jew, Instructional Designer, iTAC, K-State
Colleague 2 Colleague (C2C)'s SIDLIT
Aug. 2 - 3, 2012
Session Description: A common trend in online learning involves a focus on interactivity (how learners engage with others in the online classroom) and long-term social interactions over time (for competitive advantages). This presentation will introduce a software program that creates node-link diagrams to map social networks to show connections between centers and peripheries, the thick nodes and the thin ones, and some of the conclusions that may be drawn from these visualizations. Social network analysis has been used in a variety of fields: epidemiology, terror group analysis, cultural analysis, and even online learning. This type of research is necessarily multidisciplinary (juxtaposing disciplinary perspectives), interdisciplinary (integrative of various disciplinary data), and transdisciplinary (forming comprehensive frameworks transcending the narrower world views). On the surface alone, social network analysis draws from network analysis; sociology; psychology, and other domains. Further, this research taps unique domains to draw out analytical information. This presentation will include a smattering of some of the findings of the research on social networks. This may include the analysis of some homegrown data from an institution of higher education in Kansas.
Presentation Overview
Introduction to Social Networks
Some Social Network Research Discoveries (Examples)
SOCIALIZING
Mediated Friendships
Small World Networks
Job Hunting and Weak Ties
DIFFUSION OF INNOVATION (or Anything Transmittable)
Diffusion of Innovation
POPULATION HEALTH
Epidemiology and Herd Immunities
POWER (and the Structures of Power)
Selectorate Theory
Brokerage Roles / Tertius Gaudens / Exploiting Gaps / Breaking Groups
Terror Groups and Structures
HIGHER EDUCATION
Conclusion
Resources
Selected Social Network Diagrams
|
Let's Talk!
|
Basic Assumptions
The study of social networks assumes that human relationships matter, particularly in terms of the micro or macro social structure (the overall group members and their interrelationships). Human ties are seen as interdependent, and their social structures tend to be enduring patterns of relations.
To understand complexity, social scientists create models, or they "abstract" reality to particular entities and relationships. The idea is to select out what is relevant (the signal) and to suppress the noise--so that latent information may be revealed, and hidden structures may be revealed.
Nodes and Links
nodes / egos or actors / vertexes
o
links / lines / edges / arcs
----------------------------------------------
---------------------------------------------->
<-------------------------------------------->
The Spatial Layout of the Elements
These elements are usually presented on a 2D plane (x and y axes), and the node-links may sometimes be read from top to bottom and left to right. They may be ready from the center outward. Or there may not be any directionality in terms of reading the diagrams.
an ego network
(Note: Please click on the link in the window to view the contents. Flickr (TM) has a policy against the uses of iFrames.)
a (conceptual) neural network expressed as a node-link diagram
a content analysis expressed as a node-link diagram
an interactive content analysis examining the interdisciplinary overlap of science and social science (by Rafols, Porter, and Leydesdorff at "idR: Measuring & Mapping Interdisciplinary Research")
Early Clarification: Node-link diagrams can express a wide range of information types. One type is a "social network." (Social networks themselves may be expressed in a variety of ways, not only as node-link diagrams.)
Two Factors in the "Gold Standard" of Analytical Tools: Again, the "gold standard" is how closely the model relates to (and explains) the world...and how accurately predictive it is. In other words, this research should have explanatory power and predictive power. A social network conceptualization could be understood in this light as well. Researchers need to be able to validate the model that is created about the social network.
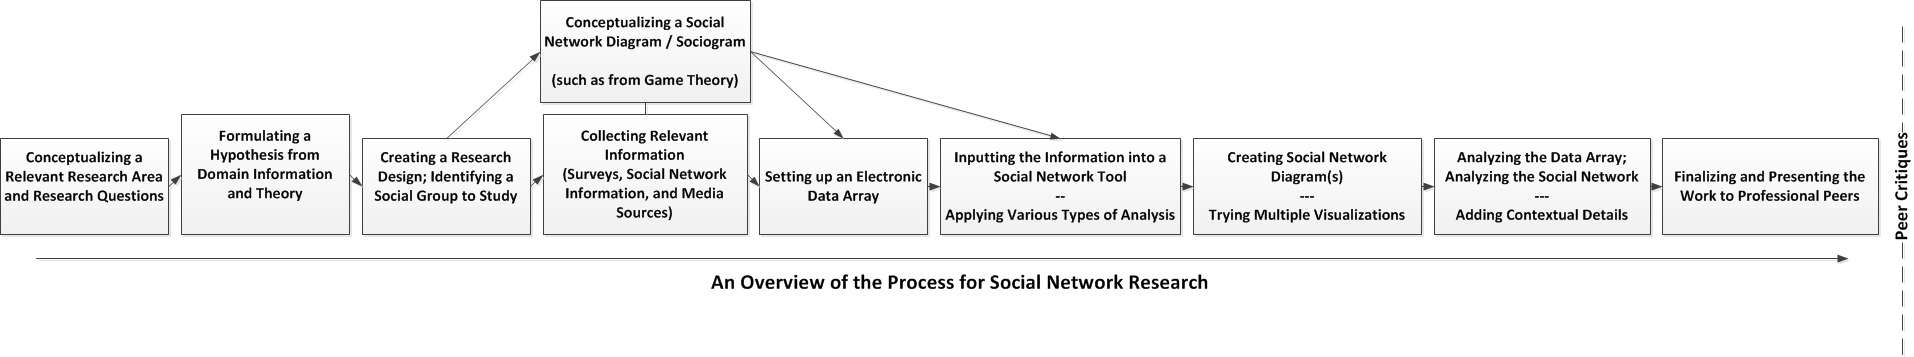
The most basic way to approach a sociogram is as a data visualization. A data visualization consists of the data, the analyst and his / her questions, the mapping of the data to various visual attributes, and some level of interactivity. A surface reading of the visual will reveal some information, but applying various statistical analysis and rendering tools to the data will reveal even more.
Micro and Macro-Level Analysis: Node-link diagrams may be understood to be evaluated both at the micro and macro levels. The micro level involves particular ego nodes, so the individual point-of-view (POV) at that egocentric level. At this level, one can look at the node trajectories. One can also look at various features of individual nodes. The macro levels involve the nature of the social network (a sociocentric view) its breadth and depth; its types of nodes (its social network composition); its various connections / connectivity; its path lengths; the density of ties; its clustering; how it evolves; and what moves through the social network. In between are subnetworks or sub-cliques that may be pulled out for analysis. "Islands" and ego neighborhoods may also be focal points for research, depending on what it is that the data analyst may want to understand. A social network may be broken out into"partitions" that make it easier to analyze.
Layering (Complex) Information: Additional information may be layered or superimposed over a social network. There are visualizations that enable multi-dimensional viewing of a social network. Each of the layers of information have to be input and rendered for the various visualizations.
It helps to apply various statistical tools and algorithms to the data in order to output different visualizations that may be revealing. A transposition of data may show the opposite of a particular factor, to reveal further information. Or there can be data turned into binary information (like a dummy variable) to draw out further information.
Underlying all sociograms are various statistical techniques used in research. Understanding these techniques is critical in terms of using the software accurately and then representing the data analysis results.
Node (Ego) Attributes: The attributes of nodes are critical as well. The attribute may be described as an identity or role with related self-interests. Or a social network may actually be populated with real-world personalities and remote psychological readings on each based on their past patterns of behaviors, public statements, and public personas. The nature of nodes affects their choices and behaviors in a strategic context. Further, nodes may play multiple overlapping roles in a social network. The visual depiction should be relevant, and it should not be overwhelmed by complexity...but it also should not over-simplify the reality. Further, without textual labels of the nodes and more nuanced measures and indicators of relationships of the links, a diagram by itself will not have deeper analytical value.
The Criticality of Context / the Social Ecology: Further, a node-link diagram cannot be understood in isolation. It has to be understood in the context of the field. Looking at a node-link diagram without the background is not deeply informative. Said another way, social networks expressed as node-link diagrams (or other diagrams) are not fully stand-alone. They are one channel of information that must be used with other channels for actual meaning. In the same way that data must be triangulated with other sources, a social network diagram offers some information that may be combined with other data--such as geographic information systems (GIS) or spatialized data, survey or self-reported data, demographic information, press reports, and published analyses.
The Representation of Entitles and Relationships: Node-link diagrams are really about entities and the relationships between those entities. There is the assumption of dynamism, stochastic factors, and node-level self-interests. The social context, though, may shape power realities.
Network Centrality: Spatiality sometimes matters in a sociogram, such as in some which may place nodes in a core, semi-periphery, and periphery. Other times, spatiality is only a tool used for the expression of certain nodes and links. There are tools within various social networking software visualisation packages that enable clearer depictions (with less visual clutter). Other times, the users of the software can manually move the nodes to locations where the relationships are more visible (and the links follow automatically). Visual coherence is critical. Further, it helps to have an aesthetic sensibility regarding the diagram.
The Need for Accurate Data Sets (on the Back End): It is not possible to truly reverse engineer a data set and a data array from a sociogram. It helps to have the original data from which the sociogram was created. In this light, it's critical to originate your own data sets and ensure that the information is high quality; otherwise, it'll be much harder to analyze the information from that data.
Random Patterns: Not every pattern found is meaningful. Some apparent patterns may be due to random error alone. (The social network visualization and the interpretation of that visualization has to make sense with other known data, to a degree.)
A Human-Created Universe (of Sorts): One philosophical point at the heart of social network research is that humans do reify certain realities. They co-create certain realities in the world. In this context, perception and human decision-making matter.
Some Assumptions of Sociometry
Costs and Transactional Relationships: There are costs to create ties and linkages to others and to maintain them. While it is costly to maintain relationships in terms of social capital / time / resources / attention and other elements (and one has to assume a transactional element in all human relationships), there are further costs and risks to breaking ties, too, particularly if one's acquaintances are linked to a particular node that one is considering breaking off from. These ties entail "constraints." They limit some freedom of action; they limit the ability to de-link (temporarily or permanently) from a network or a portion of a network.
All social alliances are strategic. They are created for particular ends. Without shared interests, alliances tend to break off. In game theory, this is referred to as the continuous Prisoner's Dilemma, in which a player chooses constantly whether to cooperate with or defect from another. (With the prospect of a continuing relationship, the optimal way is for both to cooperate.)
Social Network Types: Heterogeneous networks are more beneficial than homogeneous ones. Heterogeneous ones include much more diversity and many more links, enabling many more connections. However, networks are about those who are included and those who are excluded. There are spoken and unspoken rules for joining and maintaining membership in a social network.
What Moves through Social Networks: All sorts of things move through social networks--information, resources, habits, diseases, attitudes, culture, and other elements. Some are positive, and some are negative. Understanding social networks enables ways to engage the larger world to troubleshoot issues and to multiply positive effects and to cut off negative ones (to a degree). There is the understanding that some rewiring of social networks may be possible.
Sociograms (sociomatrixes) consist of entities and relationships depicted on a 2-D grid space / graph.
Different types of information are better aligned to be expressed in certain visual formats. Certain types of data can only be expressed coherently in certain formats.
a dendrogram (a tree diagram, usually showing taxonomic relationships)
a block matrix (a matrix consisting of smaller partitions or "blocks")
an adjacency matrix (a graph which examines the adjacency of certain vertices / nodes to others)
"For each time point, adjacency (as spatial structure) and squad membership (as social context) are significant predictors of the social relations formed among the recruits."
(Note: Matrices are used to represent multi-variate data. Block matrices compare what the data shows about relationships against a random matrix, and these are analyzed by the ability / inability to reject the null hypothesis. In other words, how much of the variance from randomness can be attributed to the particular potential causal factor? A data set may also be compared with an idealized theoretical expectation of the data set to test out particular theories or hypotheses.)
Doreian, P. & Conti, N. 2012. Social context, spatial structure and social network structure. Social Networks: 34(1), 32 - 46.
a node-link diagram
a ring lattice
a two-mode network (containing entities / nodes and "events")
Origins of Social Network Research
The precursor thinkers to the social network include the following sociologists: David Émile Durkheim (social pathologies), Ferdinand Tönnies ("gemeninschaft and gesellschaft" / community and society), and Georg Simmel (social geometry, the metropolis).
The study of social networks started in the 1930's with the work of Jacob Moreno, who originated the "sociogram"--a connection diagram which shows people's connections with each other. John Barnes (a British anthropologist) originated the term "social network" in the 1950's.
This approach has been modified over the years.
Social network research combines network analysis (from computer science); graph theory (from math), and the social sciences.
Subject Domain Influences
Social network research draws on a variety of domain fields. One source cites the following influences: sociometry, psychometry, social anthropology, sociology, ecology, organizational studies, epidemiology, linguistics, political science, and discrete maths...
This practice has come to the fore in part because of advancements in technologies that enable the mass capturing of vast amounts of electronic data through various systems: networks, the Internet, email networks, the blogosphere, social sites, communications technologies, massively multiplayer online role-playing game (MMORPG) gaming platforms, knowledge structures, library collections, newspaper repositories, and others. Electronic data extraction is often less labor-intensive than conducting full data collection "manually."
Further, the practice of analyzing trace electronic information for understanding, analysis, and decision-making, has further added depth to social network research. Trace electronic information includes the minutiae of incidental data that is available in the world that may reveal hidden patterns that may be informative about human behaviors.
Social Network Research Today
Today, social network research is highly interdisciplinary. It is used to theorize; to research; to analyze, and to make decisions. A light sweep of the research literature has brought up hundreds of articles from various areas of study.
These include work in...
Some social networks are mapped to physical spaces.
As indicated above, such "social" networks apply to animals as well. They may be used to describe phenomena in society.
A Social Network Research "Sampler" (on the following pages)
The following sections offer a small sampler of some social network research insights about
People come together around homophily or shared likenesses. People of a kind will cluster. People also cluster around shared interests.This is especially true if they connected along multiple dimensions or variables.
For strategic reasons, people may cluster in heterophilous ways, too, such as colleagues from different disciplines who collaborate around a shared project. The concept of "opposites attract" may be another form of heterophily. Indeed, people interact around patterns of differential association.
Geographical or spatial proximity matters. It affects those who will collaborate in a workplace (those within 50 feet of each other's offices). It affects who people date and marry.
An average North American supposedly has 1,500 informal ties. Of these, 20 are to significant individuals in terms of sociable contacts. Of the strong ties, only 4-7 are considered intimates (Walker, Wasserman, & Wellman, 1994).
In socio-technical spaces, people may have many "friends," but many of the same patterns of connectivity applies. Many online relationships are about influence through communications, with the collection of "followers" around opinion leaders. (Influence, of course, may be direct or indirect. With the sharing of information, indirect influences may activate individuals widely. One example of this may be seen in popular culture, with such "soft power" disseminating ideas and practices and styles widely.) Most relationships last about three years among online friends, and then unfriending and unfollowing set in.
Some researchers have expressed concerns about the research done on social networks since the nodes represent individuals, who are often identified or identifiable. There are debates about how much privacy protections need to be in place. [See Charles Kadushin's "Who benefits from network analysis: Ethics of social network research" (2005) in Social Networks: 27(2005), 139 - 153.] De-identified data about individuals often may be re-identified with a few data points (and access to other related databases), so researchers have to use due care.
Mediated Friendships
People's digital trails may be analyzed to understand patterns in human relationships. The closest ties are those which are both reciprocated and active.
Most people can only manage a hand full of close friends. The others tend to be online friends...
Males in social networks will more indiscriminately friend women who ask than females will friend unknown men.
Small World Networks / Degrees of Separation
The so-called small-world networks are described as a combination of short average path lengths over the entire graph combined with a strong degree of clustering or cliquish local neighborhoods that have evolved independently in large networks.
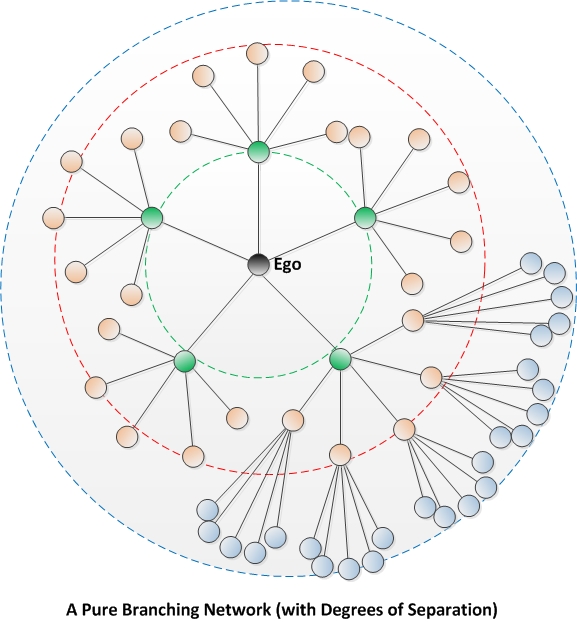
A pure branching network is perfect balance and numbers of connections and nodes. In the real world, real networks are not based on randomness but on human tendencies to connect in preferential ways. That selectivity affects the types of intimacies that people create. This is why social networks show patterns of differential association.
The more connections there are, the more ways there are for people to connect to socialize and problem-solve. Denser networks can disseminate all sorts of exchangeable elements, some positive and some negative contagions, too.
Job Hunting and Weak Ties
Sometimes, social network research results in some counter-intuitive findings. For job hunting, the weak ties in one's circles are better than strong ties. The reason is that one already has access to the resources of the strong ties. Those who are bridges to other communities multiply the power of connectivity.
References
Walker, M.E., Wasserman, S., & Wellman. (1994). "Statistical Models for Social Support Networks." In Stanley Wasserman and Joseph Galaskiewicz's Advances in Social Network Analysis: Research in the Social and Behavioral Sciences. Thousand Oaks: Sage Publications. 64.
|
Let's Talk!
|
The art and science of how to "diffuse" or propagate an innovation into a population has been the work of many applied social scientists, psychologists, and researchers. After all, various organizations have impetuses to sell certain products, lifestyles, behaviors, and values--for their various interests. If there are efficient and effective ways to diffuse innovations, then most organizations will pursue those efforts. Some of these endeavors include advertising and marketing; they include using people's homophilous social networks to reach other potential like-minded individuals or "reference group".
"Contamination" in a Social Network: All sorts of things move through a social network. The adoption of new things in a network is called "contamination".
What Moves through a Social Network: These things that move through a network--ideas, resources, information, techniques, attitudes, behaviors, infections like STIs (sexually transmitted infections) and diseases like STDs (sexually transmitted diseases), and products--may be considered positive or negative (or neither), depending on the individual ego node and on the social network. Innovations are generally seen as positive, but that again is a subjective approach. It may well be that certain ideas and practices may promote the diffusion of a particular product, so there are "interaction effects" between elements that are diffused in a social network.
Accelerators for Diffusion: Certain individuals are seen as accelerators of innovations. Certain "fat nodes" may have outsized impacts as "leaders" in particular social environments. Those with low thresholds for infectiousness (meaning that they are open to innovations in the system) are likely to be highly responsive to adopting new elements diffusing through the social network. (Sometimes, social competition--like "keeping up with the Joneses"--may be a factor in adoption of particular innovations.)
Saturation in a Social Network: "Percolation" refers to a certain point of saturation when an epidemic suddenly sparks and spreads quickly. Until that percolation point, an epidemic may remain silent and unseen.
Those with higher thresholds may reach the limit of pressure when all the direct nodes one degree out (directly connected) have all converted. This assumes a kind of peer pressure influence.
Not Correlational Predictiveness: The research does not show a clear correlational predictiveness about innovation though, so the researchers have gone to examining the various uniqueness of nodes to understand why some convert, and others do not. There is not a systematic relationship of adoption of innovations. In that light, researchers have started looking more closely at the attributes of individual nodes--such as personality, decision-making, preferences, and other aspects, that may influence whether that node (individual) adopts something new.
The way the various "diffusion of innovation" scenarios manifest will differ based on the element that is studied as well as the particular social network. Further, how the diffusion is measured will affect the data.
0 or 1, No or Yes: In a sense, people can choose the binary "no" or "yes" regarding such innovations that come through their social networks. To choose suggests multiple dependencies: awareness, choice, and volition. Oftentimes, though, elements may move through a social network with such speed or silence that people do not notice the adoption. Or they may not realize they have a choice (or further, they may not actually have a choice). Sometimes, emotions carry the day, so choices are not logical cognitive ones but are affective or emotion-based. Other choices are made passively--through non-action (such as not opting out).
Groupthink at one Extreme: In terms of group decision-making, this diffusion can become insidious, with everyone lining up behind an idea that is first mentioned ("the Abilene Paradox") in a way that may be unthinking and detrimental to choices. To avoid this, some groups assign individuals to provide "minority report" opinions. Others work hard to create an open atmosphere, so that a variety of opinions may be welcomed at any time. Research has found that having even one dissenter to a majority opinion may open the way to a wider range of ideas considered. A dissenting opinion may break the spell of a dominant idea.
The psychological phenomena of "cognitive dissonance" may mean that people will discount conflicting information from what they have committed to mentally. Dr. Daniel Kahneman also talks about the WYSIATI ("what you see is all there is") phenomena, which can lead to poor decision-making when people think they have sufficient information and stop looking further (or stop sampling the environment for more information).
Diffusion of Innovation
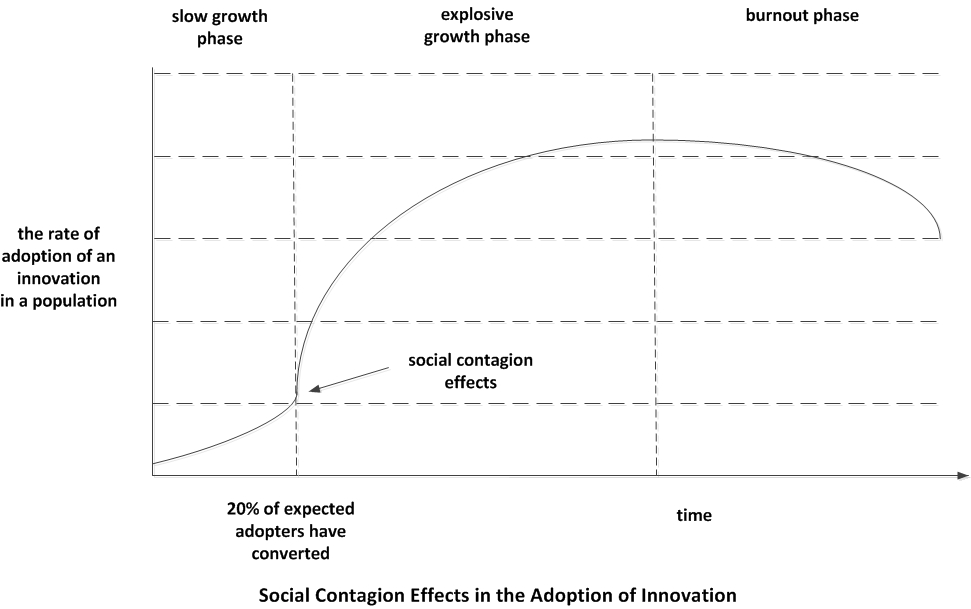
The above curve assumes that sufficient momentum may be achieved if a certain proportion of a population (critical mass) may buy into a new approach, and at the 20 percent mark "go viral" with people sparking each other to adopt.
|
Let's Talk!
References
Underwood, P. & Welser, H.T. (2011). 'The Internet is Here': Emergent coordination and innovation of protest forms in digital culture. In iConference. Seattle, Washington. ACM. 304 - 311.
|
"Social factors...regulate the patterns of interpersonal contact and thus the structure within which transmission is channeled." -- Martina Morris in "Epistemology and Social Networks: Modeling Structured Diffusion" (1994) in Stanley Wasserman and Joseph Galaskiewicz's "Advances in Social Network Analysis: Research in the Social and Behavioral Sciences" (Sage Publications, Inc.)
(Fine, Eames, & Heymann, 2011, pp. 911 - 916)
A number of features of diseases and the biologic agents that lead to disease are of concern to epidemiologists. One of these is how virulent a disease agent is in terms of its destructive potential. Another aspect is how contagious that agent is and its various potential routes of transmission. The initial prevalence of a disease in specific parts of a population affects how it disseminates and moves through the population. Epidemiologists and those who work in public health must pay attention to the specific indicators of health in the subnetwork level because that is where first indicators of a disease outbreak tend to show up.
If the reproduction rate of a disease (R) is more than one, that is the mathematical condition for an epidemic. People known as "super spreaders" tend to have a much higher reproduction rate for a disease than others. They are highly infective.
Too often, people assume that certain types of infectious diseases are "distant dangers," when in fact the spread of a pathogen in a population is much wider. (This is a social network insight.) Contagious diseases in small-world networks (and the global connected world) cuts across boundaries and sub-groups. From a social network point-of-view, the spread of disease among an already infected population ("infecteds") is less risky (network-wise) than the spread of that disease into susceptible other populations. Research into scale-free networks that are based on power-law structures means that much greater volatility is possible. Sub-networks or sub-clusters may act as incubators to disease which may then jump into a larger population. It is in the interests of society to keep the "stable mixing groups" as healthy as possible but also to keep nodes that would bridge infections and disease to other parts of the population as inactive as possible.
If unchallenged, such infections may reach a percolation stage and become an epidemic or pandemic. In theory, the effort is to control the "disease front" where the infective individuals might interface with susceptible populations. (Efforts at international airports to stop people with high fevers and potential signs of avian flu in the 2003 outbreak and occasionally thereafter are an effort at limiting just such weak links that bridge infected populations with non-infected. Airborne pathogens like influenza viruses, which can also transfer via fomite, are of especial concern because of how highly contagious they are. There are debates on how effective this effort is. The risks of so-called "global cascades" are real and are threats.) The general strategy is to use a variety of tools--law enforcement, medical interventions, behavioral interventions, informational and public relations work--to slow the growth of infectious diseases, to isolate them, and to keep them in control. If it is possible to eradicate the pathogenic agent, then that is done (although humanity has only been able to really stamp out smallpox). Cascades are of especial concern in scale-free networks (whose distributions display power laws) because in such networks, there are particular nodes that are highly influential on other members of the social network. If one such influential node is converted or infected, that node may result in the infections of many others in "cascades."
The reverse concept is the concept of developing "herd immunities." This concept involves the vaccination of a large proportion of a population (or herd) as a measure of protection for those who have not developed immunity. If a sufficient number of a population are immunized, that lowers the probability of an infection cutting a wide swath into the population and sparking a potential epidemic or pandemic. Further, having an immunized population may lead to a decline in the incidence of infection.
social networks testing (to understand diseases)
"Social Networks Testing": Using Social Networks to Reach People for Healthcare (Centers for Disease Control and Prevention / CDC)
With some diseases that may spread through casual contact, like the common flu, the assumptions of social "random mixing" may be used to model the spread. Unintentional contacts (and even unnoticed contacts) are sufficient conditions for influenza to find a foothold in a population and burn through the individuals. However, this model does not apply to diseases that require a different form of close contact for transmission.
Vega and Ghanem (2007) observe: "Sexual behavior, in particular, has strong social components that involve a web of social relations, expectations, issues regarding confidence in one's abilities, beliefs about risk, and the perceived severity of STIs and their sequelae." (p. 142) What that means is that health interventions have to consider bio-behavioral interventions to decrease disease transmission.
When HIV-AIDS first came to the awareness of the general public in the early 1980's, there was research done that showed that one index patient was linked to spreading HIV to hundreds of others (through social contact-tracing). Epidemiologists will track-back various interconnections between people to try to understand how disease entered a population and spread. The spread of sexually transmitted diseases has been modeled using "pure drive" models in which individuals (nodes) have a certain number of quota to achieve. If a certain target group is less available, they will substitute others from a different group to meet the partner need to fulfill the quota (Morris, 1994, p. 39). People respond to the availability of others in the social environment.
The following is a non-narrated simulation of a fictitious virus burning through a population. Please note the parameters set at the left. This model was created using the open-source NetLogo software. There are citations below. This is included here to show a more dynamic visualization than a cross-sectional node-link still.
For more about the above model (about which you saw just a small snippet), please see the attached Word or .pdf files from the open-source NetLogo Model Library.
Virus on a Network References
(Section) References
Fine, P., Eames, K., & Heymann, D.L. (2011). "'Herd immunity': A rough guide." Clinical Infectious Diseases: 52(7), 911 - 916. Oxford Journals.
doi: 10.1093/cid/cir007."Herd immunity." Wikipedia.
Morris, M. (1994). "Epidemiology and social networks: Modeling structured diffusion." In Stanley Wasserman and Joseph Galaskiewicz's "Advances in Social Network Analysis." Thousand Oaks: Sage Publications. 26 - 52.
Vega, M.Y. & Ghanem, K.G. (2007). STD prevention communication: Using social marketing techniques with an eye on behavioral change. In Behavioral Interventions for Prevention and Control of Sexually Transmitted Diseases. S.O. Aral & J.M. Douglas, Eds. J.A. Lipshutz, Assoc. Ed. New York: Springer Science + Business Media, LLC. 142. - 169.
|
Let's Talk!
|
Some Lessons in Power
Selectorate Theory
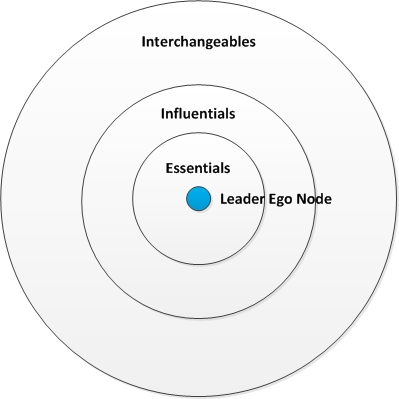
Drs. Bruce Bueno de Mesquita and Alastair Smith describe "selectorate theory" in political science which suggests that countries' leaders tend to use a very basic power equation in their governance that is all about protecting their own power by rewarding those whom they need to stay in power. Their book is about ways to structure governance to make leaders more responsible for a broader constituency in order to encourage more responsible and ethical government. At the heart of their argument lies a social network concept that is very similar to the core, semi-periphery, and periphery of a social network. Those in the periphery are the dispossessed masses (the "interchangeables") whose concerns are not considered by many government leaders. Those in the inner core are the "essentials"; in the semi-periphery are the "influentials," and on the peripheral outside are the "interchangeables".
Reference
Bueno de Mesquita, B. & Smith, A. (2011). The Dictator's Handbook: Why Bad Behavior is Almost Always Good Politics. New York: Perseus Books.
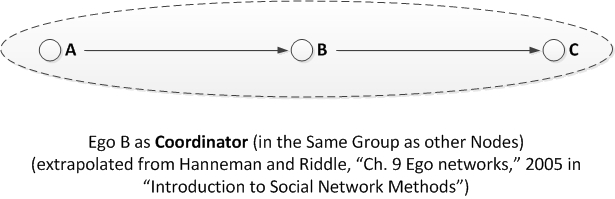
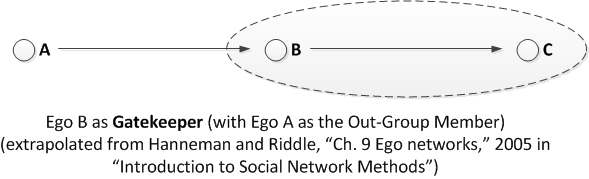
Brokerage Roles / Tertius Gaudens ("the third who benefits") / Exploiting Structural Holes
Brokerage Roles
Coordinator
Consultant (or "itinerant broker")
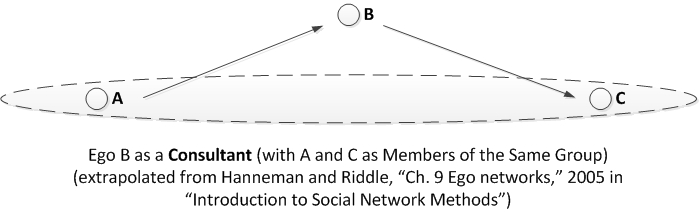
or "itinerant broker" (de Nooy, Mrvar, & Batagelj, 2005 / 2011, pp. 174 - 174)
Gatekeeper
Representative
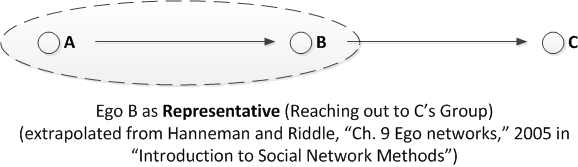
If in an undirected network, gatekeepers and representatives fit in the same category.
Liaison
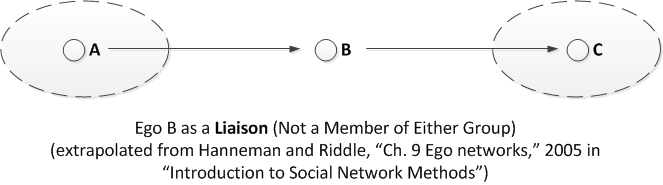
In these brokerage roles, power derives from relationships and access to resources. Further, how a node / agent / vertex plays out the power relationships affects the outcomes.
What Brokerage Tells Analysts about a Social Network
The various software programs have algorithms to search out the various types of brokerage ties to understand the overall nature of a social network. There are various types of social networks. Those that have lines without arrows are known as undirected networks. Those that have arrows on the lines are considered directed networks or directed graphs (or "digraphs").
The various types of relationships are defined as well. An "isolate" is a node that is not connected to anything. A "pendant" is a node that dangles on the edge of a network with maybe only one connection. A thin node is one with a few connections. A fat node has many incoming connections (with resources coming in), but fewer nodes going out (suggesting that a lot of the resources stay with that node). In social networks, popular fat nodes have more incoming attention (like followers in a social network) and less out-going. The "in-degree" for fat nodes are higher than the "out-degree." Some theorists assert that in preferential attachment models, nodes prefer to link to vertices with higher in-degree (e.g., popularity).
An island is a sub-network or subcluster of nodes that are densely connected with each other but less densely connected with the larger networks.
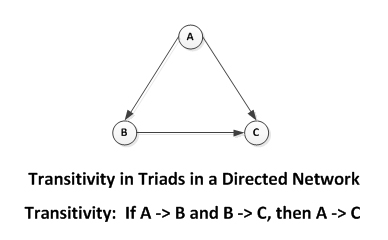
Further, there are many theories of network types (balanced networks, cyclic and acyclic networks, hierarchical vs. distributed ones, high transitivity to low transitivity ones), but very few real-world social networks conform perfectly to the theories.
A wholly hierarchical network only has information moving up, none coming down with all resources accruing at the top.
Less hierarchical networks may still be ranked based on the interactions within that network. In cases where there is cyclic movement and reciprocation and clustering, those nodes are considered to be of the same social grouping or banding (in a hierarchy).
Structurally "equivalent" brokerage conditions may suggest that a particular node setup may substitute for another. This enables work-arounds in a social network that may help create resilience. (Resilience, in systems theory, includes system attributes "as diversity, ability to self-organize, system memory, hierarchical structure, feedbacks and non-linear processes" (Cumming, Barnes, Perz, Schmink, Sieving, Southworth, Binford, Holt, Stickler, & Van Holt, 2005, p. 975). These authors note that "resilience" may be understood as the amount of change that the system may undergo while maintaining its structural and functional integrity. Further, the system's ability to learn is another aspect of system resilience.
[The above image was derived from De Nooy, Mrvar, & Batagelj (2005, 2011)].
Network Censuses: The software analyzing social networks can draw out various combinations of these triad relationships in a "triad census." It can pull out hidden relationships that are not easily viewable by the human eye. There are other censuses in the software programs that enable the finding of certain "network motifs" or structures that appear in various types of social networks.
Node Analysis and Population Base Rates: The software can be used to identify different characteristics of the nodes. At minimum, an analyst may draw out base rate characteristics of a population. (A % has this characteristic. Another % has this characteristic.)
Static vs. Dynamic Depictions of Social Networks: Social networks are dynamic; they change over time. (Certain networks may have very different forms if they are going through crises or different phases of development). This reality of time-series data may be represented as time slices, or this may be seen as a dynamic animation Social networks are not static, but they may be depicted as a moment-in-time freeze-frame reality. There are ways to model dynamism in terms of how a social network evolves over time in regards to particular dimensions. Some social networks are populated with real-time data, which suggests synchronicity in the moment for "situational awareness" now.
Reference
Cumming, G.S., Barnes, G., Perz, S., Schmink, M., Sieving, K.E., Southworth, J., Binford, M., Holt, R.D., Stickler, C., & Van Holt, T. (2005). An exploratory framework for the empirical measurement of resilience. Ecosystems: 8, 975- 987. DOI: 10.1007/s10021-005-0129-z.
De Nooy, W., Mrvar, A., & Batagelj, V. (2005, 2011). Exploratory Social Network Analysis with Pajek: Structural Analysis in the Social Sciences. Cambridge: Cambridge University Press.
Tertius Gaudens vs. Tertius Iungens
In a triad (three nodes in relation to each other), the tertius ("third who joins") strategy occurs when one player acts as a broker between two other nodes and benefits from the disunion of the two others (known as "tertius gaudens" or "the third who benefits / rejoices" per George Simmel, 1923). A common example is a seller of a product which is being bid over by two others. Tertius gaudens occurs when there is a node which can step into a structural hole at a strategic moment which allows the individual to have control over the relationship between the two actors divided by the structural hole. A key point in brokerage involves identifying such gaps and taking advantage.
A converse idea is that of tertius iungens or ("the third who joins"). In this case, the third who joins two nodes has a more positive role between the original two, by bringing nodes together for mutual benefit (not exploitation). Further, it is understood that the nodes are selfish and each working in their own best interests. The information moving among the triadic nodes may be accurate, ambiguous, inaccurate, or even distorted / manipulated.
Identifying and Exploiting Structural Holes
A structural hole occurs when two parties (nodes / egos / vertices) are separated structurally and need a third party to mediate. This may be in a case of a divorcing couple or a seller and buyer of real estate. The go-betweens in such cases may have undue power in terms of what will occur between the two nodes. (There is a motivation for the two nodes themselves to interact to limit the power of "the third who benefits," but there may be structural or personality or other reasons why that may not be possible.)
Web Logs (Blogs) /Microblogs and Polarization
Re-Tweeting (Microblogging) and Political Polarization
"When Computation met Society"
(Note: This is conducted with text analysis tools as well.)
Terror Groups and Structures
"Connecting the Dots: Tracking Two Identified Terrorists" (by Valdis Krebs in orgnet.com)
Deep analysis of the structures of terror groups--their leadership, the various functional roles, the recruitment, the funding streams, the messages and solicitations, and so on--may give those working in intelligence ways to break up the groups through removal of certain critical nodes (leaders); compromising particular individuals in the network; misinformation; and other strategies. They may find ways in to insert individuals into the network based on the organization's perceived needs and functional gaps. They may look to break down brokerage roles for the highest impacts, to weaken or dismantle or destroy the group.
Suggested Readings
For more, read Edward P. MacKerrow's "Understanding Why--Dissecting radical Islamist terrorism with agent-based simulation," (2003) in Los Alamos Science.
Also, read Rebecca Linder's "Wikis, Webs, and Networks: Creating Connections for Conflict-Prone Settings" (2006) for the Center for Strategic and International Studies (CSIS).
|
Let's Talk!
|
Currently, academic publications have included social network research in a variety of domain fields:
The Secret Life of a Work Group in iTAC (at K-State)
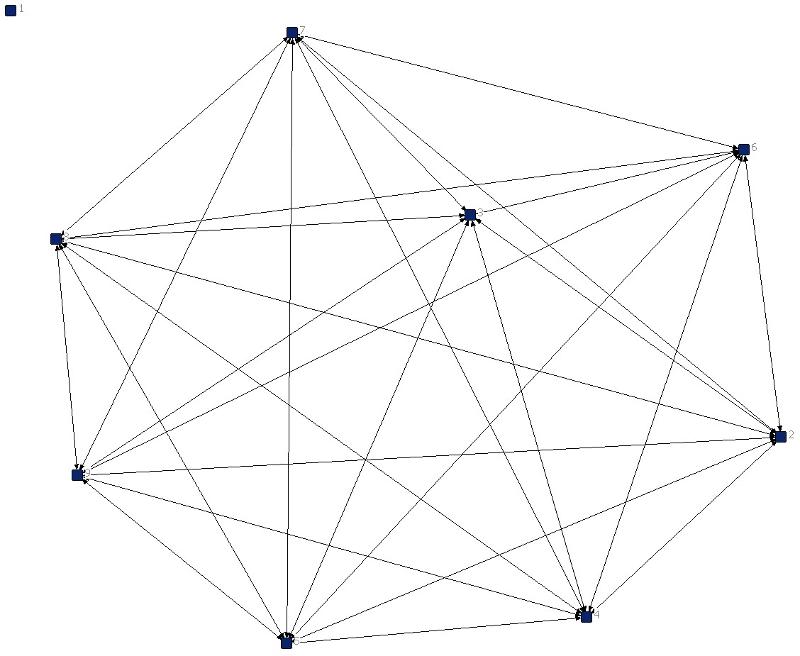
(Note: The "isolate" node at the top left is actually an artifact of my Excel file. The members of the group run from Nodes 2 - 9. This shows that the members of the team are highly interconnected with each other. There's a lot of communication going on. This is my first node-link diagram using UCINET.
Earlier, I've drawn others manually with Microsoft Visio. That would be known as the hypothesis-driven approach to thinking and research, beginning with an educated idea. Using a data visualization tool like UCINET, though, enables much more data-driven analysis--letting the information depict the social network and relationships. This latter approach begins in a somewhat unstructured way, which enables the software to examine the coded data and find out what relationships exist within that data set.
This particular workplace network looks fairly resilient. It is not very hierarchical. It looks like communications and resources move fairly evenly throughout the team. There are no obvious "fat nodes" because of the even distribution. There is no clear way to exploit the relationships here because of the resilience and lack of non-transitive triads.)
In online learning, the social networks have focused on how to promote community building in an online classroom for more communications. Co-authorship networks have been explored to understand whether small-world networks exist in various research fields (they do). There are explorations of the (Paul) Erdõs number to see how closely a researcher in a domain may relate to a particular prolific researcher.
What are some other potentials? What research would enhance awareness and decision-making in higher education? ("Neural network" depictions are node-link diagrams as well, with complex decision junctures modeled as complex sequences of yes / no decisions. Such networks are complex types of "decision trees," in one conceptualization.)
|
Let's Talk!
|
3-D Node-Links
"Building and Analyzing Node-Link Diagrams to Understand Social Networks" was created to offer a high-level view of what node-link diagrams representing social networks are...and some of their applications in the world. My aim was to both acquire a sense of node-link diagrams used in the context but also to provide F2F audience members and site visitors an "intuition" for such data visualizations.
This presentation relied extensively on existing information out in the "wild" of the Internet and World Wide Web (WWW). To actually begin doing work in this area suggests plenty of prior preparatory work and background knowledge and some hardiness in acquiring knowledge of how to use a new technology.
It is hoped in the next round, you will be able to see how a social network research software works.
The statistical tools for the analysis and visualization of social networks are evolving at this very moment. In a future presentation or publication, I hope to explore those in more detail, too.
Now, to make something of all this... :)
"Simple Network Analysis with UCINET" by Mo-Han Hsieh (MIT's OpenCourseware)
(Note: Per this presenter's initial experiences with UCINET, it makes more sense to start with an Excel table. Then, after the table is placed in UCINET and visualized, one can return to the table and make adjustments to the structure, labels, and informational cells describing the relationships. It helps to explore different visualizations of the data, such as turning a social network into a ring lattice or "circle." Assume correctly that there's a lot to learn and that as one learns, one may slowly bring in complexity. A social network visualization tells an angle of a story, but there's always more to a story than one aspect.)
|
Dr. Shalin Hai-Jew, Instructional Designer iTAC Kansas State University shalin@k-state.edu 785-532-5262
|
Thanks to Jerome S. for his introduction of the UCINET software technology and his cool social network visualizations. Thanks also to Phyllis Epps and Dr. Rebecca Gould for encouraging my curiosity about this technology and allowing me some space to pursue this interest.
Please consider!
Call for Chapter Proposals: Packaging Digital Information for Enhanced Learning and Analysis: Data Visualization, Spatialization, Predictiveness, and Multidimensionality
Call for Chapter Proposals: Remote Workforce Training: Effective Technologies and Strategies
As a side note, FreeMind 0.9.0 (an open-source software started by former developer Dmitri Polivaev) offers a "mind-mapping" technology that outputs interactive as well as static mind maps (that are essentially node-link diagrams).
The FreeMind User Guide (in .pdf format and written by Shailaja Kumar) offers some helpful advice. That said, the software's interface itself is very intuitive. There are foldable nodes to enable easier handling of complex structures. Branches may be broken off and made into their own mind maps (.mm files). The following is an image of one branch of a curriculum (expressed as a "word tree") that demonstrates the use of this tool (for content analysis).
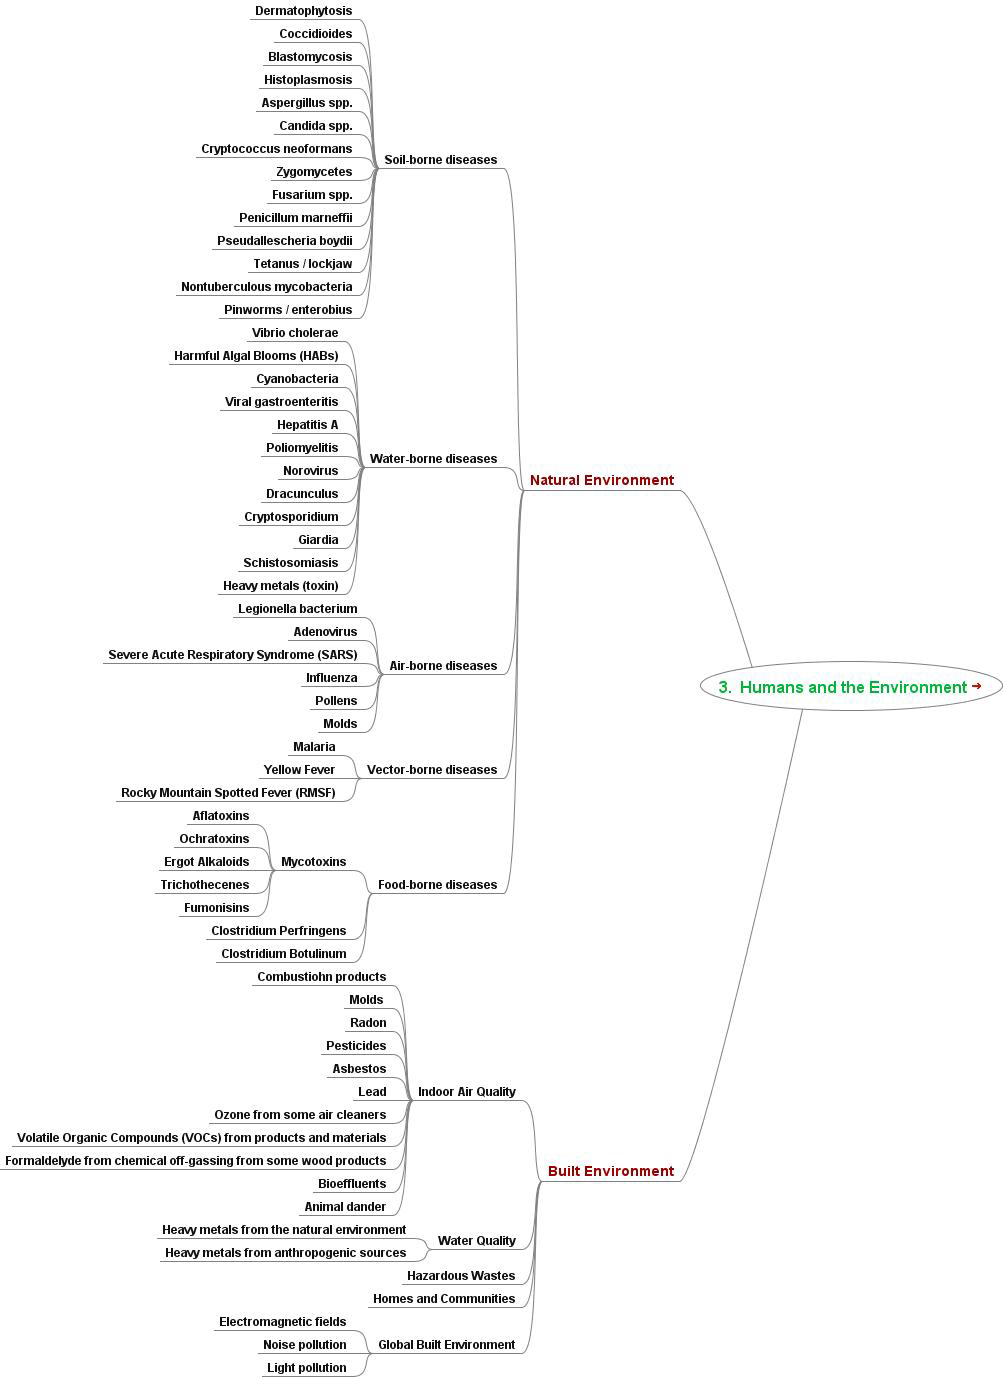
An Interactive Outline:
For an interactive outline of the curriculum, please interact with the following diagram. This is a general overview of an online course curriculum and does not actually fully represent the entire curriculum.
Post-conference, I came across an open-source tool that looks like it does some of the work that the proprietary UCINET also does. This tool is called Gephi. I have not tried it yet, but those who do should let me know what they think.
Another intriguing tool is an open-source one that is an add-on to MS Excel. NodeXL is downloadable off of the CodePlex site. There are tools that extract social network information from Twitter, Facebook, YouTube, and other sites. The visualizations are dazzling. This tool was made under the auspices of the Social Media Research Foundation.
Actor: An individual with agency who acts within a social network (and is represented as a node or point)
Acyclic network: A network which does not contain any cycles or reflexive links in which two nodes exchange resources (Acyclic networks include article citations which only refer in one direction—in the past—to refer to published works...or highly hierarchical organizations with resources and information only moving upwards to a central node.)
Adjacency: The phenomena of being neighbors
Adjacency matrix: A matrix in which individuals who are next to each other in a social space are listed together side-by-side (and thus the adjacency label); this matrix looks at the effects of proximity
Adoption curves: A distribution which shows the rate of acceptance or adoption of a new idea, technology, practice, or other aspect
Affiliation: The nature of interactions between vertices (nodes)
Affiliation network: A two-mode social network that consists of actors and events (as mutually exclusive categories, with no crossover in information type)
Affinity: A liking or sympathy for others; a sense of closeness
Alter (connections): Directly connected nodes to a focal or "ego" node; also known as neighbors in an ego network; nearest neighbor
Amplifier: A factor that magnifies or enlarges another force or message or energy
Arcs: Directed lines (with arrows on one or both ends) in a directed graph or directed sociogram
Asymmetry: An imbalance in a social relationship (or directed ties); potentially an unreciprocated relationship in which one side perceives a bonded tie and the other side does not
Attribute: A descriptor (descriptive variable) of a node; may lead to preferences or biases
Automorphic equivalence: The parallel structures existing between nodes and links; the concept of substitutability between nodes with similar structures (and presumed capabilities); a sense of similarity of roles within a social network
Backtesting: Testing the verifiability of a model by comparing what the model would suggest would happen given certain historical inputs as contrasted with what actually happened in those historical situations
Balanced / imbalanced networks: A theory of networks that suggests certain types of relationships within the network,with the idea that most networks work towards balance
Betweenness centrality: A measure of a node's or ego's centrality in a network (the number of shortest paths from all vertices to all others that pass through that node)
Bias: A preference of a vector or node in a social network
Binary graph: A graph which represents nodes as either a "yes" or "no" / present or non-present (binary) about a particular variable or phenomena
Block (bi-component): Elements (or divisions) of connected nodes in a graph that may be separated into components with the deletion of cutpoints
Blocking the matrix: Partitioning parts of a social network represented in a matrix to create blocks; sectioning off the matrix into partitions
Bonded ties: A reciprocal (co-present or co-occurring) relationships between two vertices or nodes (with the relationship represented as a double-headed arrow)
Broadcast search: Projecting a generalized message with a search request to the entire network
Broker: An individual who negotiates between two other parties; a go-between who manages informational or other resources / assets
Circle graphs: A diagram that places the vertices or nodes in a circle in order to highlight the actual connectors (lines, edges) between the various vertices or nodes; this form shows the highest concentrations of connections
Citation network: A social network of research citations showing which works are the most popular (or the most often cited)
Clique: A substructure in a social network in which every element of the set is connected to every other member of that set at a distance greater than one; a maximal fully-connected sub-graph which is a part of a larger graph or social network (with other variable definitions based on various analyses)
Closed trail: A walk between two actors that begins and ends with the same actor
Closed walk: A sequence of connections between two actors with clearly defined start and end points
Cluster: Groups of people represented as individual vertices who share dense close ties in local neighborhoods because of shared mutual interests; cohesive subgroups with various types of affiliations
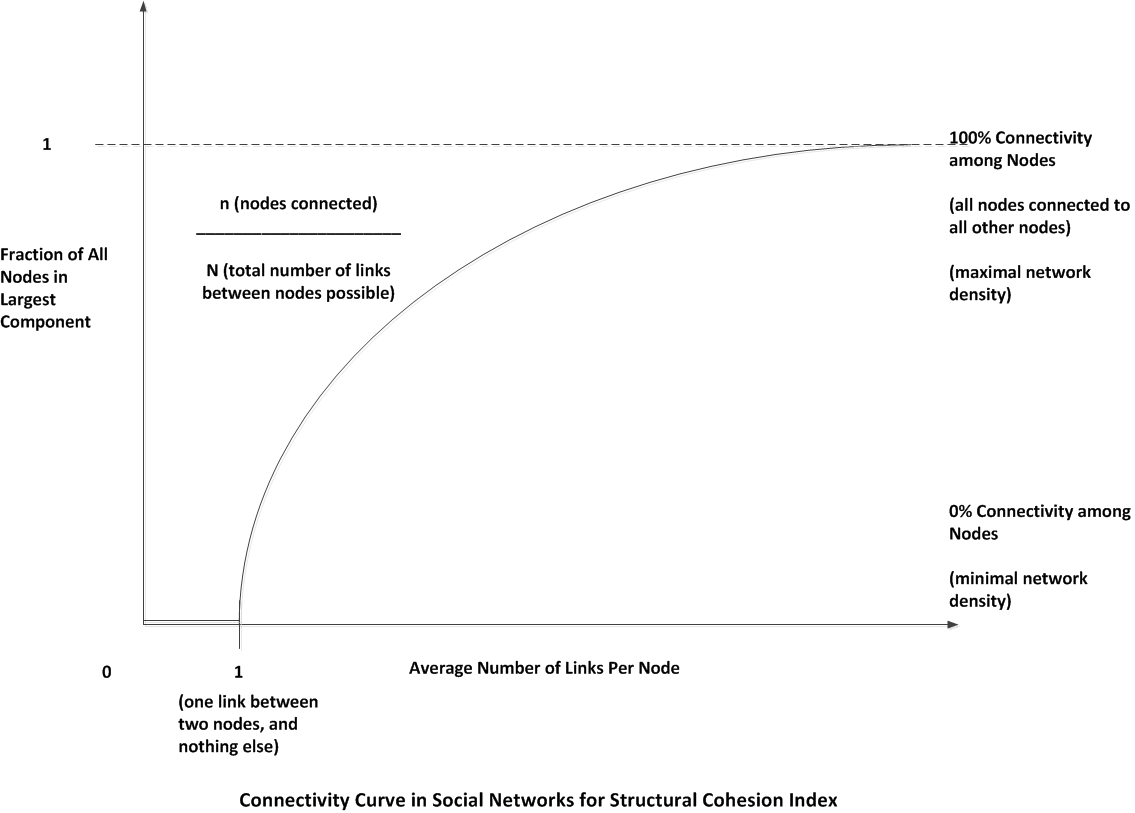
Cohesion: The structural cohesion of a social network is determined by the degrees of vertices (the numbers of connectors leading to and from the vertices, which may be averaged out to describe the network's structural cohesion); a highly cohesive network can move information / messages much more efficiently
Complete network: A network with maximum density (theoretically where all possible vertices are connected? A network with high cohesive ties?)
Connected phase: A point at which a network changes from a disconnected phase to one where a critical point (or a "tipping point") has been reached where a sufficient number of nodes have converted to accepting a new practice, and there are sufficient numbers to maintain momentum on its own or to accelerate momentum of conversions
Constellation: A node-link diagram that depicts data that is associative or hierarchical
Constraint: A limitation or restriction; something that constrains
Contamination: The process of diffusion of something (an idea, a technology, a practice, a meme, or other element) through a social network
Co-present or co-occurring: Ties between vertices which require the participation of the involved nodes in a particular event; bonded ties
Critical mass: A sufficient amount of nodes (adopters) that may enable a network to achieve a "tipping point" or sufficient momentum to be self-sustaining in the acceptance of a new innovation (in a diffusion of innovation model)
Cutpoints: Places in a network where the removal of a node would divide the structure into unconnected parts; weak links / brokers / bridges between otherwise disconnected groups in a graph
Cycle: A restricted walk of three or more actors (nodes), all of whom are distinct except for the origin / destination actor
Cyclic network: A network with clusters that are generally within one rank with equality among the vertices
Data array: The setup of a data set in a spreadsheet (or multiple spreadsheets) with variables listed across the top row and each of the following rows below as individual records, with unique identifiers running down the left column (a classic rectangular data array)
De-duplication: Removing any repeated data from a data set to ensure clean data
Degrees of separation: The concept that people may be connected by close ties in a "small world" through low degrees of separation in the "human web" (an initial idea by Dr. Stanley Milgram); the famous "sx degrees of separation" suggests that people are only six steps away from anyone else in the world by the six steps (in a concept expressed by Frigyes Karinthy and popularized in a play by John Guare)
A dynamic version of this may be seen here.
This visualization was created on NetLogo and is courtesy of the following:
References
Wilensky, U. (2005). NetLogo Small Worlds model. http://ccl.northwestern.edu/netlogo/models/SmallWorlds. Center for Connected Learning and Computer-Based Modeling, Northwestern University, Evanston, Illinois.
Wilensky, U. (1999). NetLogo. http://ccl.northwestern.edu/netlogo/. Center for Connected Learning and Computer-Based Modeling, Northwestern University, Evanston, Illinois.
Dendrogram: A branching tree ("dendron") diagram which depicts a hierarchy of categories based on degree of similarity or shared characteristics, usually used in biological taxonomy. These may be used to represent pedigree or genealogies. For example, common ancestors of academic traditions may be cited as influences in citation dendrograms (in academia); non-biological affinities may be represented in dendrograms. Genealogies show ties to common ancestors.
Density: The number of lines (connectors) in a simple network, described as a proportion of the maximum possible number of lines or ties (a percentage of extant lines or arcs divided by all possible lines or arcs)
Diameter (of a social network): The length of the longest path between connected actors; the span of the network (as an indicator of size)
Diffusion: The spreading of an innovation, disease, practice, information, or some other element through a social network (often enhanced by the density of the social network)
Directed graph (digraph): A node-link diagram that has directional lines (the presence or absence of arrow-heads at the line ends) or arcs indicating directional aspects of relationships (including whether the connections are reciprocated or not)
Directed search: Reaching out to a targeted few in a social network to locate particular information or resources
Direction: The course or impetus of a relationship
Dyad: A pair of vertices (nodes) and the lines linking them
Eccentricity: A measure of how far one node is from the furthest other in a social network (the mean and standard deviation of their geodesic distances to describe their closeness to other actors)
Edges (ties, lines or links): Line indicators in a social network that indicate relationships between individuals, cliques, and groups in that social network; undirected ties (lines without arrows showing directionality on the ends)
Ego: A focal node, a vertex that represents a specific individual or agent (from whose perspective the other aspects of the network may be viewed) and the various alters connected to that node (others in the "neighborhood"); an ego may also refer to groups, organizations, or even whole countries or societies
Ego network: A social network of various individuals with a special focus on the local (neighborhood) connections of individual actors; a vertex (node) and its neighbors, including all the lines among the selected vertices (nodes)
Embeddedness: The closeness of a particular node in an ego-network with other members, characterized by dense local sub-structure connections; the extent to which actors are in social structures with "dense, reciprocal, transitive, strong ties" (Hanneman & Riddle, 2005, Ch. 9, "Ego networks," p. 1)
Equivalence: A state of similarity between vertices with "zero dissimilarity" (or similarity of a lesser degree)
Eulerian circuit or cycle: A Eulerian trail (a path in a graph which visits every line exactly once which starts and ends on the same node or vertex)
Fat node: A vertex or node which has high in-degrees of lines or arcs or edges as well as high out-degrees of lines, showing high connectivity and assumed popularity and influence
Geodesic: The shortest path between two vertices or nodes
Graph: A systematic and condensed representation of information; a set of vertices or nodes and a set of lines between pairs of vertices (including some non-lines between vertices)
Hierarchical clustering: A form of cluster analysis that builds a hierarchy of cluster based on criteria such as affinity or relatedness (used in genomic data), often expressed in a dendrogram
Immediacy index: A measure of a publication's power in terms of the citations to the contents within the year of its publication (a rate based on the immediacy of response within the publication year)
Impact factor: A measure of a journal's power in terms of how many other articles cite that work
In-group: A social group to which an ego node belongs
In-degree: The amount of lines leading in to a particular node
Innovation: A high-innovation individual is a person with a low threshold for adoption of a new technique or technology; the tendency to be susceptible to new ideas moving through a social network
Intellectual pedigree: The association of an individual with other thinkers or practitioners in a field (in an affinity)
Interdependence: A mutually reciprocal relation between entities
Island: A maximal subnetwork of vertices connected by lines with values greater than the lines to vertices outside the subnetwork; a large cluster of highly interactive nodes with fewer connections to the outside
Isolate: A node which is not connected to other nodes in a network; a node which is on the periphery of a social network without anything in the way of a connection or relationship tie
Isomorphic equivalence: The visual equivalency of structure between ego nodes
Legible: Able to be read; clear
Length (of a walk): The number of relations contained within a walk
Linegraph: A nodelink diagram that indicates relationships by lines in between connected nodes
Lines: Edges (without arrows, in an undirected social network diagram) and arcs (with arrows, as "directed lines" in a digraph)
Loop: Reflexive connections from one node back to itself
Logistic growth: A sigmoidal (S-shaped) curve in which the growth rate decreases with the increasing number of entities until it reaches zero at a maximum point; a curve that models a gradual increase initially, a more rapid middle growth period, and then a slowing off at the end at a maximum value (sometimes used to model the diffusion of innovation in a population)
Main path analysis: A technique for analyzing citation networks that transport scientific knowledge of information over time in time increments, where a "main path" moves from a source vertex to a sink vertex with the highest traversal weights on the arcs in between
Matrix: A visualization of multivariate data consisting of rows and columns, with cells at the intersection of a row and a column; here each row and each column represent one vertex; a filled cell means the presence of a phenomenon while a blank cell means the absence of a phenomenon (in a binary); these can be reconfigured to be sorted by various descriptors of the groups to identify patterns
Multiplier effect: An entity or resource whose use will magnify or amplify the impact
Multiplex data: A stack of actor-by-actor matrices with similar defined factors, enabling comparability; data capturing the multiple roles of social actors
Multiplex relations: Multiple relationships among multiple vertices to show more complex relationships (as contrasted to "simplex" relations)
Neighborhood: The area around an "ego" including the "alters" that are linked to the focal ego node; this includes a connection up to some maximum path length (with a minimum of at least one step of connection); includes all the ties among all of the actors to whom the ego has a direct connection; these may be indicated by color or a circle or some other indicator (or sometimes no indicator at all)
Neighbors: The "alters" or direct nodes connected to an ego node in a neighborhood
Network analysis: Learning about social networks based on analyses of various aspects of the relational ties between the individuals in the network
Network load: The amount of traffic or information or other network resources that move through a network
Network size: The number of original nodes or egos (or individuals, groups, organizations, or societies) in the network
Node: A point or vertex in a social network which represents an individual (or actor) within that network
Node load: The measure of load placed on a given node to show its importance to the network; load is based in part on how connected that node is to other nodes (and the directions of the relationships between nodes
Nonbiological (non-kin) affinity: The ties between individuals who were influenced by the same predecessors and so are considered to belong to the same family or tradition in a field
N-step neighborhood: The size of an ego's neighborhood including all nodes at a path length of N, inclusive of all the connections among those actors (most neighborhood path lengths are 1, which include the egos and their adjacent nodes)
Null dyads: A pair of vertices (nodes) without any lines between them (no connectors)
Ordinal data: Rank-ordered data
Outdegree: The number of lines or edges leading from a particular node
Out-group: A social group to which an ego does not belong
(Pure) out-tree: A sociogram in which all actors are embedded into a single component as one structure, with no reciprocated ties and each node with an in-degree of one (or each actor has one boss, in a unified command, except the ultimate boss)
Partition: A part; a section
Path: A walk in which each actor and relation in the graph may be used at most one time (except for a closed path in which the first actor is also the ending actor); a Eulerian path defines a once-through of a network that touches every path / line once except for the starting node or vertex
Pendant: A case or node which is connected to the graph by only one tie; this has earned its name because such cases will "dangle" off more central cases that are heavily connected
Percolation theory: The concept that sudden changes seem to occur after a certain amount of percolation of changes, at which a tipping point is reached in connected clusters in a random graph
Perfect hierarchy: A social network in which all arcs (directional lines) point up, and none point down; an acyclic social network (a network without cycles or without arcs pointing down returning to a starting point); a perfect hierarchy suggests that all such networks have a concentration of power at the top with resources and information moving up and a potential enervating of the peripheries
Periphery: The outer edge of a social network, usually represented by nodes that are not connected to others in the network or are connected thinly to others
Permutation: The reordering or sorting or renumbering of vertices of a network to highlight particular descriptions of the network (with other patterning)
Popularity: The state of being recognized, appreciated, and liked by many
Power curve: An exponential curve that shows a high incidence of the phenomena early on but with a steep drop-off and then a long tail (said to represent various phenomenon in the world)
Power law: A mathematical relation between two quantities, when the frequency of an event varies as a power of an attribute; a power law distribution starts at its maximum value and decreases to infinity; this features a long tail leading towards infinity with a slower decay than the decay rate for a normal distribution, which suggests a greater likelihood of extreme events or variability
Predictive analytics: The uses of data to anticipate future behaviors, events, and trends, among other things (This is a kind of "forward testing.)
Property (bias): Tendencies as defined by node descriptors; tendencies extrapolated from node descriptors
Proximity: Closeness or nearness based on various dimensions: physical, spatial, relational, structural; temporal; emotional, or otherwise; vicinity
Random network: The nature of a network if the null hypothesis for the contents cannot be rejected; what a random network would look like (with each of the nodes having an equal opportunity of being chosen in this randomized network)
Rank: Stratification within social groups (whether discreetly or indiscreetly expressed) that may be inferred by the way information moves in a social network
Reachability: Any set of connections which trace from a source to the target actor
Salience: Importance, criticality, most noticeable
Scale-free networks: Networks whose degree distributions display power laws
Semi-path: "A semi-walk in which no vertex in between the first and last vertex of the semiwalk occurs more than once" (de Nooy, Mrvar, & Batagelj, 2005 / 2011, p. 78)
Semi-walk: A sequence of lines from vertex u to vertex v such that "the end vertex of one line is the starting vertex of the next line and the sequence starts at vertex us and ends at vertex v" (de Nooy, Mrvar, & Batagelj, 2005 / 2011, p. 77)
Sensitivity: The ability to respond to slight environmental or other changes
Simple graph: An undirected graph (nodes without lines)
Sink vertex (or "sink"): In an acyclic network (usually used for networks in time), a vertex with in-degree links (as the receiver of ties) but zero out-degree (which suggests an ending vertex on the periphery of a network or at least at the end of a main path analysis)
Small world phenomena: The existence of a social network in which there are clusters of nodes which enable the connection between one node and another through a few number of steps; a social network in which strangers may be connected through a mutual acquaintance; technically defined to be "a network where the typical distance L between two randomly chosen nodes (the number of steps required) grows proportionally to the logarithm of the number of nodes N in the network" ("Small-world network," Wikipedia) where
![]()
(For more on "small-world networks," visit the prior link from Mathematics Illuminated.)
Sociogram: A social network represented as a graph (bar charts, pie charts, trend charts, line charts, and others), node-link diagram, or other graphic display
Social prestige: Social recognition or respect
Social roles: A set of connected behaviors and obligations for individuals in a social situation (may be formal or informal)
Sociogram: An informational graphic that shows social links or the social structure of an individual, a group, or other social relations
Sociometry: The study of relationships among people, usually quantitative tools
Source vertex: In an acyclic network (usually used for networks in time), a vertex with zero indegree (no lines going into it, suggesting that these are originating vertexes)
Strong component: A maximally connected (cyclic) sub-network in which each vertex can reach any other vertex (with pairs of lines going in both directions to all vertices)
Strong link: An interpersonal tie that is close, long-standing, and over-which many resources may be exchanged
Structural hole: A triad of three nodes with one connected to the two nodes, who are not directed connected to each other
Structural prestige: The "social respect" indicated by the importance and power of a node in a social network
Subnetwork: A social cluster within a network
Symmetry: The sense of a balanced relationship (directed ties) in which two individuals (nodes) share the same sort of tie (bonded or non-bonded)
Thin node: A vertex with a low degree of connectivity with other vertices; low connectivity; low popularity
Threshold: A minimum limit which must be attained to create a certain effect
Trail: A walk between two actors that includes a given relation no more than once
Transitivity: A state of: when A = B and B = C, then A = C (from algebra)
Transposition: Switching the locations of two different objects with each other; reversing the order of objects
Traversal count / traversal rate: The extent to which a citation or article is needed for linking articles
Tree: A structure within social networks which do not contain any semicycles or cycles; a structure often used to show genealogies in time
Triad: Three vertices (nodes) which may be combined in a range of ways by the lines between them
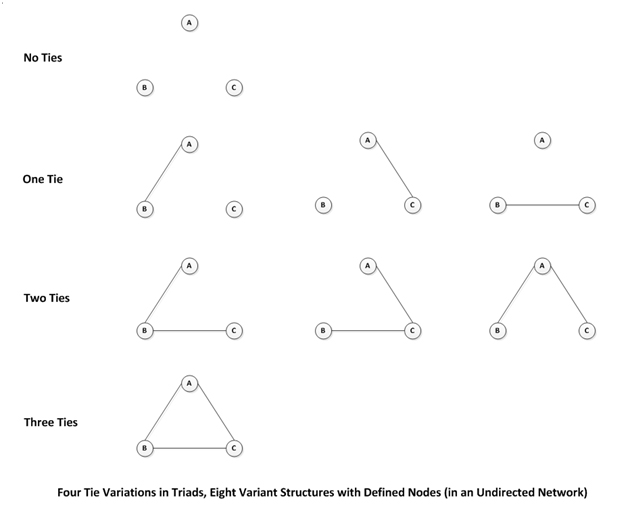
Triad census: A listing of the triads in a social network (based on the types found as compared to the numbers expected); four possible types of triadic relationships are possible—with no ties, one tie, two ties, or three ties (in a nondirected network)
Triadic closure: The idea that if Node A knows B and B knows C, then Node C is more likely to know A than just anyone picked at random
Undirected lines (edges): Unordered or undirected pair of vertices or nodes
Universal classes: Groupings of networks which share broad assumptions and about which descriptive generalizations may be made
Universality: The idea of shared descriptions between various social networks
Valued graph: A graph that represents how the various individuals surveyed think or feel about a particular issue in terms of a ranked measurement
Vector: An entire social network matrix or part of a larger matrix; a singular column of data (that is part of a matrix)
Vertex (vertices, plural): The common end point of two or more rays or line segments; a corner or a point where lines meet (a point where three or more edges meet, in solid geometry); the highest or lowest points in a parabola (as in a quadratic equation)
Walk: The most general connection between two actors, usually a sequence of actors (nodes) and relations that begins and ends with actors; a sequence of nodes
Weak link: A weak tie between nodes; a link that is weakly traveled or weakly used
Borgatti, S.P., Everett, M.G. & Freeman, L.C. 2002. UCInet for Windows: Software for Social Network Analysis. Harvard, MA: Analytic Technologies.
Christakis, N.A. & Fowler, J.H. (2009). Connected: The Surprising Power of our Social Networks and How They Shape Our Lives. New York: Little, Brown and Company. 197.
De Nooy, W., Mrvar, A., & Batagelj, V. (2005, 2011). Exploratory Social Network Analysis with Pajek: Structural Analysis in the Social Sciences. Cambridge: Cambridge University Press.
Hanneman, Robert A. & Mark Riddle. (2005). Introduction to social network methods. Riverside, CA: University of California, Riverside ( published in digital form at http://faculty.ucr.edu/~hanneman/ )
Watts, D.J. (2003). Six Degrees: the Science of a Connected Age. New York: W.W. Norton & Company.
Introduction to Social Network Methods (Robert A. Hanneman and Mark Riddle)
Hanneman, Robert A. and Mark Riddle. (2005). Introduction to social network methods. Riverside, CA: University of California, Riverside (published in digital form at http://faculty.ucr.edu/~hanneman/ )
http://faculty.ucr.edu/~hanneman/nettext/
Some Readings: Variations on a Theme
Kim, KT., Ko, S., Elmqvist, N., & Ebert, D.S. (2011). WordBridge: Using composite tag clouds in node-link diagrams for visualizing content and relations in text corpora. IEEE.
Ware, C. & Bobrow, R. (2004). Motion to support rapid interactive queries on node-link diagrams. ACM.
Zhao, S., McGuffin, M.J., & Chignell, M.H. (2005). Elastic hierarchies: Combining treemaps and node-link diagrams. IEEE.
Downloadable Data Sets
Public Data Sets (for UCINET): http://vlado.fmf.uni-lj.si/pub/networks/data/ucinet/ucidata.htm
Preexisting Electronic Information
Some types of research draw from the textual communications between individuals and groups in online spaces like computer-supported collaborative learning (CSCL) work spaces; newsgroups; wikis; web logs (blogs); micro-blogs, help ticket systems, and other spaces. Others involve "scraping" social networking technologies. Still others draw from learning / course management systems and back-end data. Others conduct online or electronic surveys. Some use the online tagging features of various networks. Some are able to tap "big data" such as those gathered by large entities like Facebook(TM) and Google(TM), reportedly two or the largest data collectors in the world today.
Google Plus and Circles of Trust (2011)
http://d3.do/en/?p=306
Some Questions: Who are the friends we have in our trusted inner circle? What are the power balances / imbalances in this social network? Are our friendships reciprocated or not?
What elements work to ensure long-term friendships? Which ones ensure short-term ones? When is each type preferred?
"Enron Offers an Unlikely Boost to E-Mail Surveillance"
http://www.nytimes.com/2005/05/22/weekinreview/22kola.html?_r=1&pagewanted=1&ei=5070&en=4cf193faf4bb7e12&ex=1138597200
Finding Patterns in Corporate Chatter (Visualization)
http://www.nytimes.com/imagepages/2005/05/21/weekinreview/20050520_KOLATA1_CHART.html
On their Minds in 2001
http://www.nytimes.com/imagepages/2005/05/22/weekinreview/20050522_KOLATA2_CHART.html
Some Questions: Who is speaking to whom? What anomalies are there in terms of new accounts? New messaging? What sorts of thinking trends are going on in a company?
(Note: There are articles on using wiretap programs to map social networks, which would make for a possibly insightful law enforcement approach.)
Map of Scientific Collaborations from 2005 to 2009
http://collabo.olihb.com/
Some Questions: Which are the locations where the most scientific work is taking place? Which countries / regions' scientists are collaborating? And why? And about what?
"Wiring diagrams for complex networks"
"Schematic illustration of regular and random network architectures"
Strogatz, S.H. (2001). Exploring complex networks. Nature: 410, 268 - 276. doi:10.1038/35065725.
Invisible Cities
http://www.christianmarcschmidt.com/invisiblecities/
Some Questions: What is trending now in a social hotspot in terms of microblogging and photosharing (Twitter and Flickr)? Which places accrue the most digital data (as represented by the changing landscape)? What are some paths people take for fun activities over the span of a night or a day?
http://nd.edu/~networks/Image%20Gallery/gallery.htm